Weekly support and resistance levels
- Indicatori
- Antony Augustine
- Versione: 2.0
- Aggiornato: 2 maggio 2023
- Attivazioni: 10
In the stock market technical analysis, support and resistance is a concept that the movement of the price of a security will tend to stop and reverse at certain predetermined price levels.
Support and resistance levels can be identified on any timeframe. However, the most significant ones are found on the higher time frames, such as daily, weekly, and monthly.
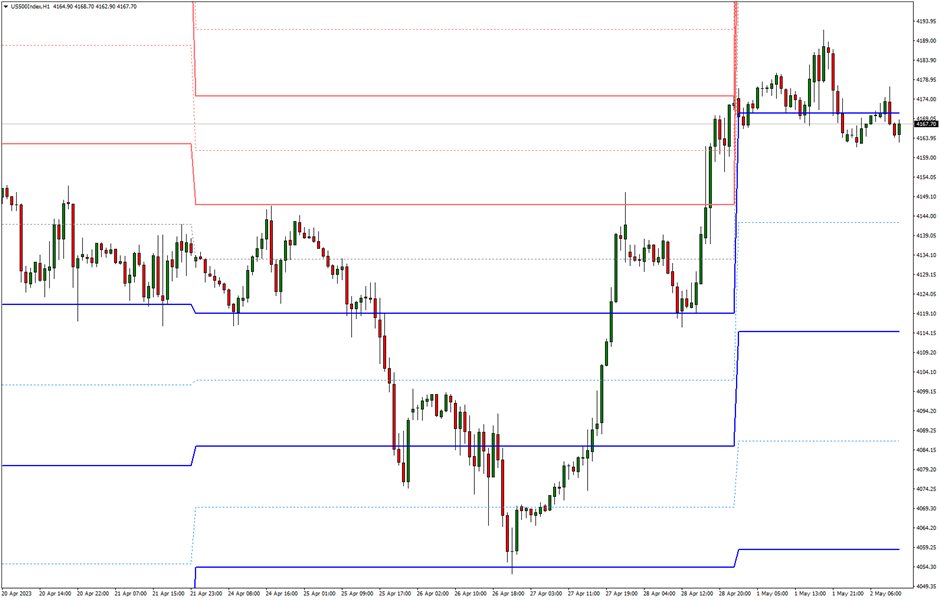
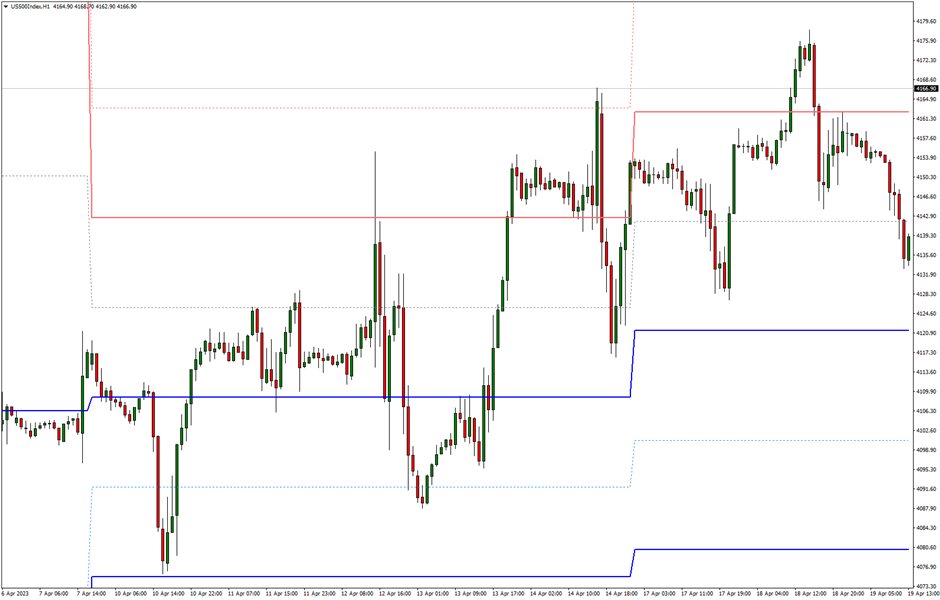
This indicator using the weekly OHLC data to identify the relevant levels. This is a support and resistance indicator and providing major and minor levels.
Features
- This indicator does not repaint and never changes levels in the history. For all you can see in the history, the indicator will show exactly the same in real time.
- It is leading indicator, the SR levels are available before price reach there, and it is not repaint and not lagging either.
- The indicator displays the key intraday support and resistance levels.
- The levels are generated at begin of weekly session starts.
- The support and resistance indicator is used to trigger counter trend trades and determining the target and stops.
- High probability of market reaction on the support/resistance lines
- It works on any instrument.

