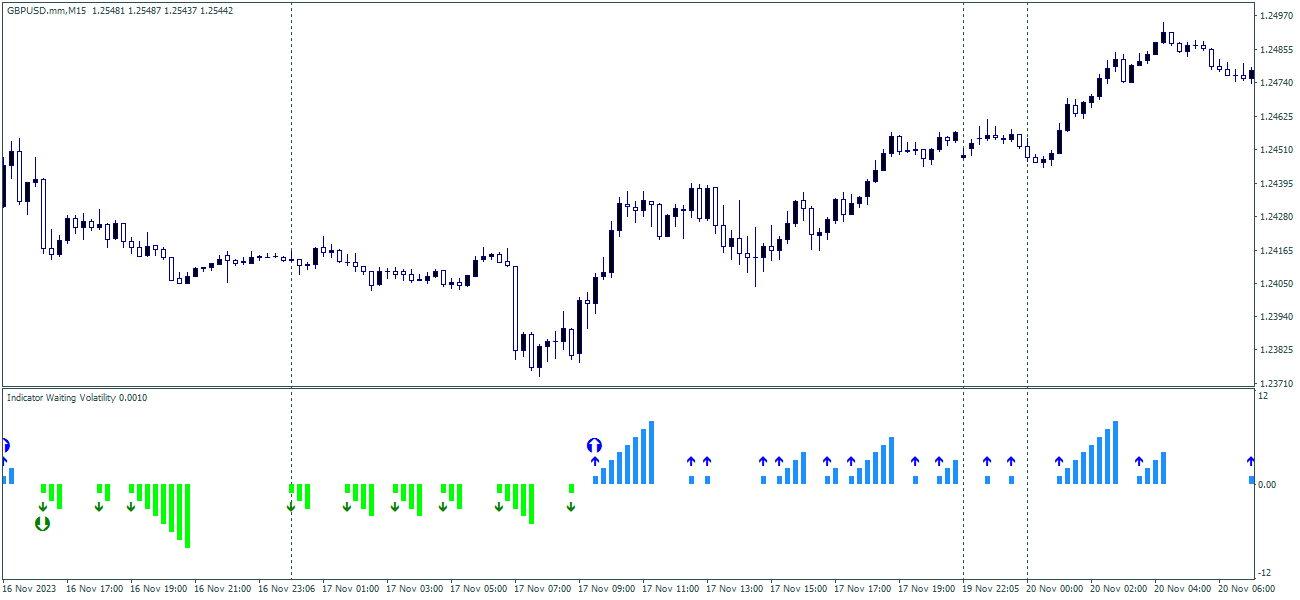
Indicator Waiting Volatility
- Indicatori
- Vitalyi Belyh
- Versione: 1.0
- Attivazioni: 7
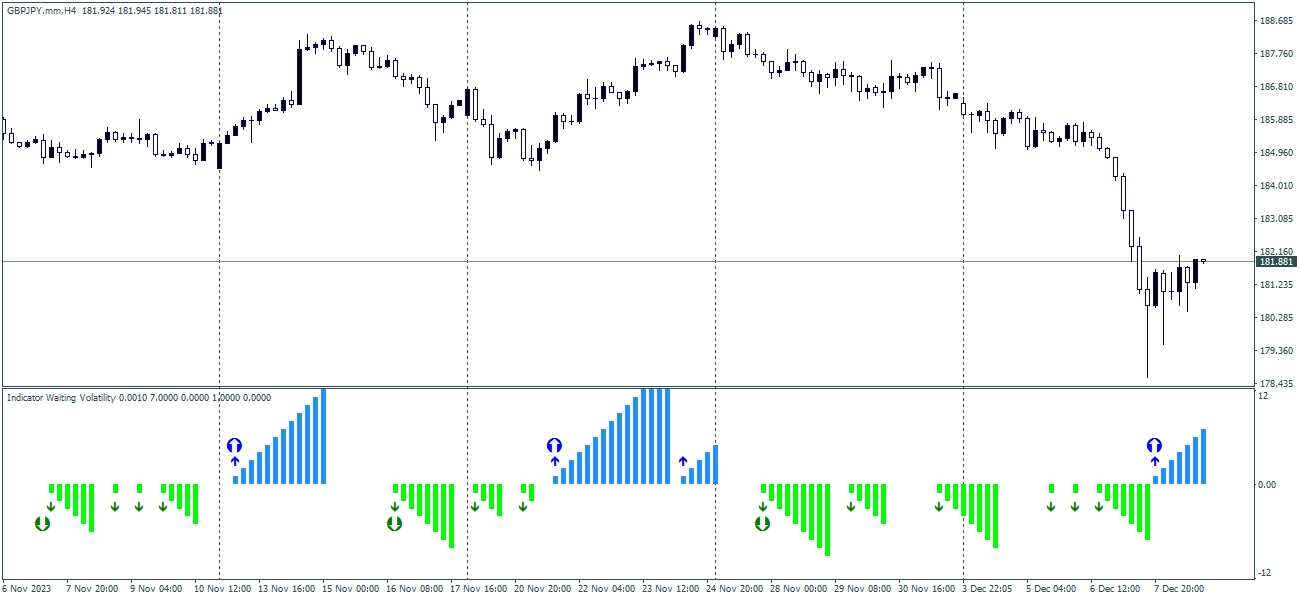
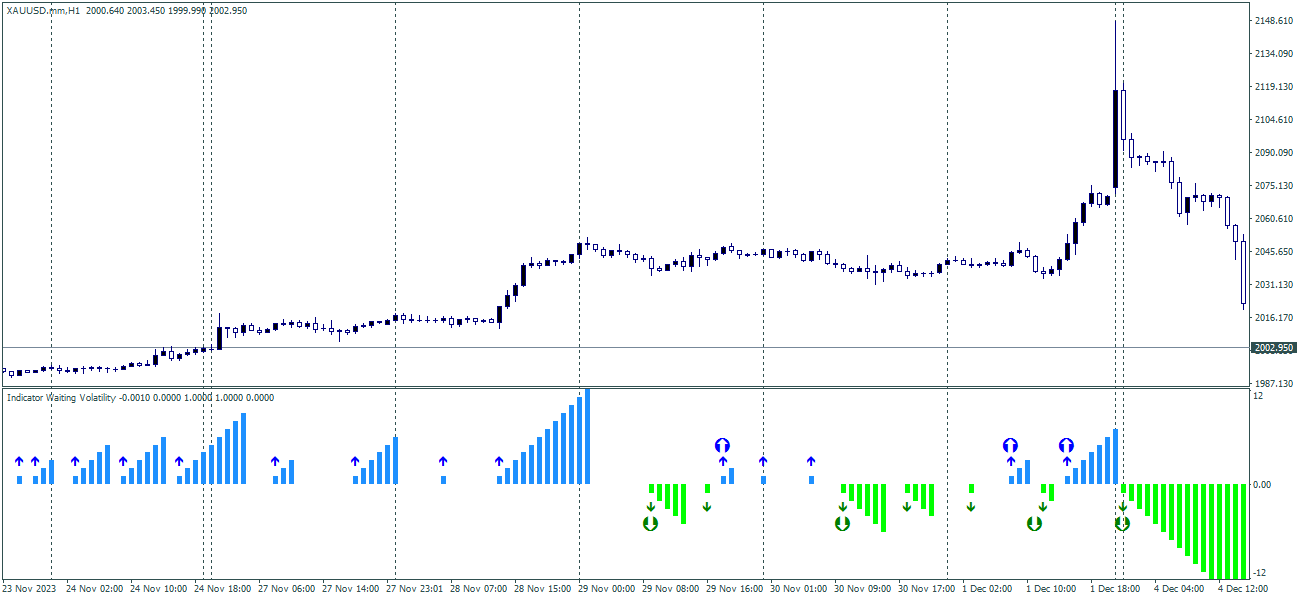
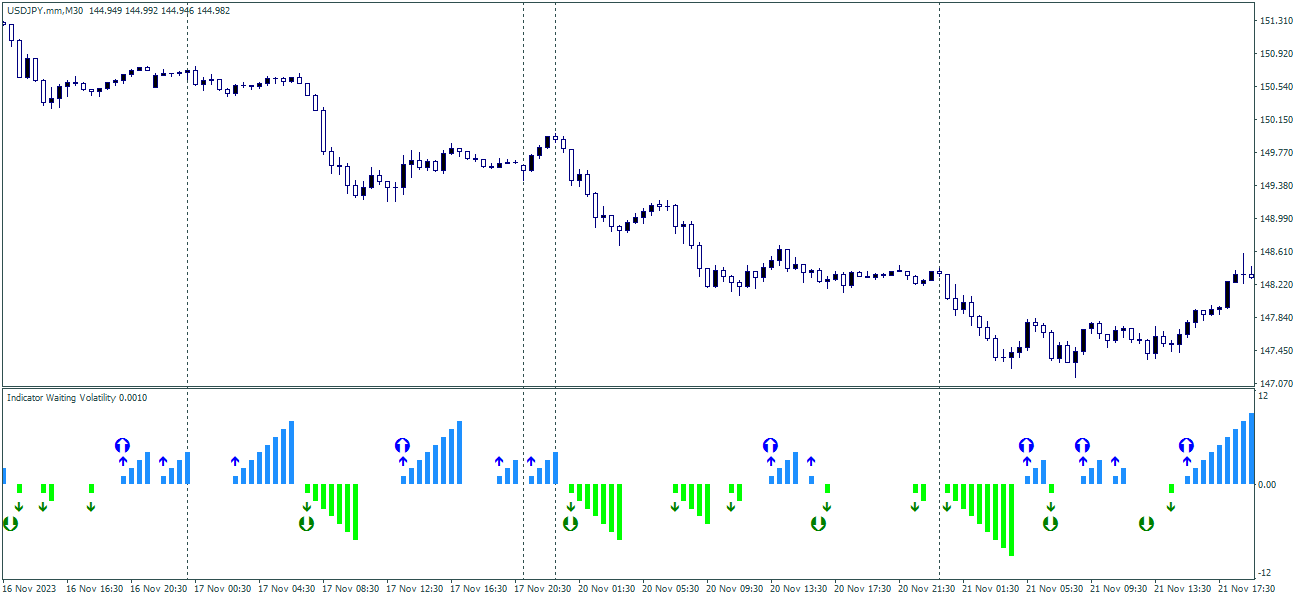
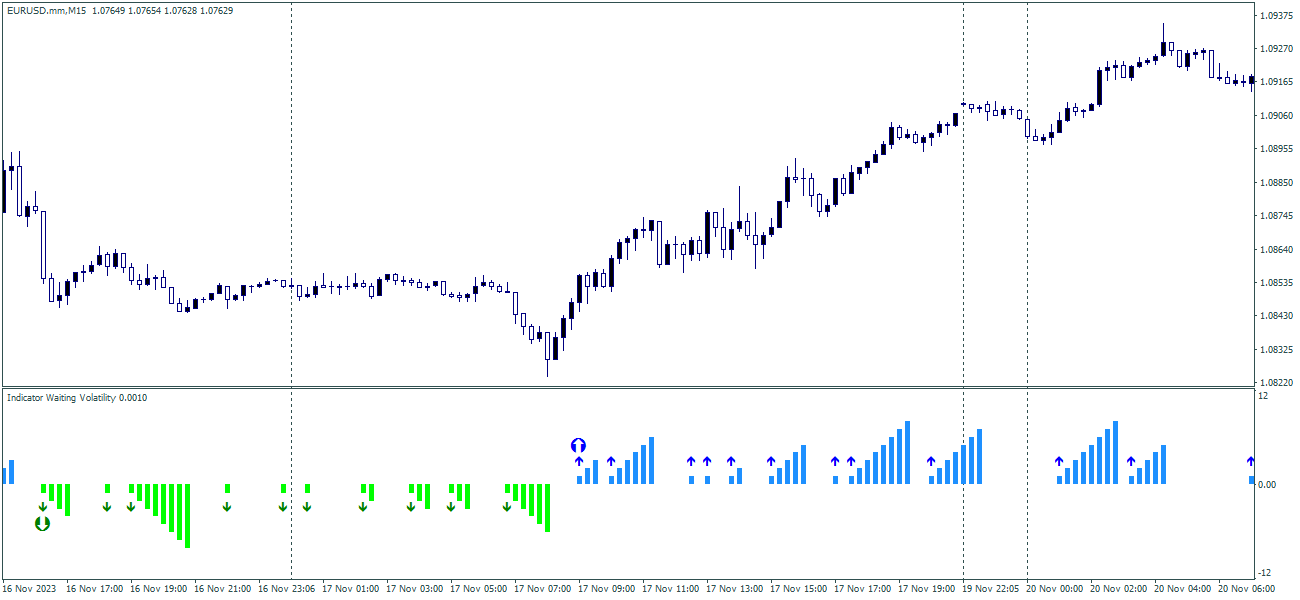
Indicator Waiting Volatility - un indicatore per determinare le zone di volatilità e le condizioni piatte.
Nel corso del tempo, il prezzo sul grafico segue trend diversi, scende, sale o rimane lo stesso. L'indicatore aiuta il trader a determinare in quale tendenza si trova il prezzo.
Nel suo lavoro utilizza diversi strumenti per l'analisi tecnica; in primo luogo, viene determinata la direzione del trend, quindi, in questa direzione, l'indicatore monitora i cambiamenti nella volatilità.
Se il prezzo fluttua all'interno del rumore, è in modalità tracciamento; quando il prezzo va oltre il rumore del mercato, mostra i valori corrispondenti.
- La determinazione della tendenza viene effettuata tramite parametri configurati internamente, sono possibili solo piccole regolazioni per la durata desiderata della " Trend Correction ". (da -1 a 10)
- Puoi configurare manualmente il parametro " Duration of Volatility ", che determina quante candele utilizzare per calcolare il segnale. (dalle 4 alle 20)
- e " Appearance of a Signal " - determinazione su quale barra fornire i segnali, 0 - il segnale potrebbe scomparire / 1 - il segnale non scomparirà.
- L'indicatore può essere utilizzato su qualsiasi strumento di trading; l'intervallo di tempo consigliato va da M15 a D1.
- L'indicatore fornisce anche diversi tipi di avvisi.
- L'indicatore può essere utilizzato in modo indipendente, tenendo conto dei suoi potenziali segnali di trading o per costruire i propri sistemi di trading basati sui dati di volatilità dell'indicatore.