ChartGetSignal
- Indicatori
- Wartono
- Versione: 1.4
- Aggiornato: 28 dicembre 2023
- Attivazioni: 20
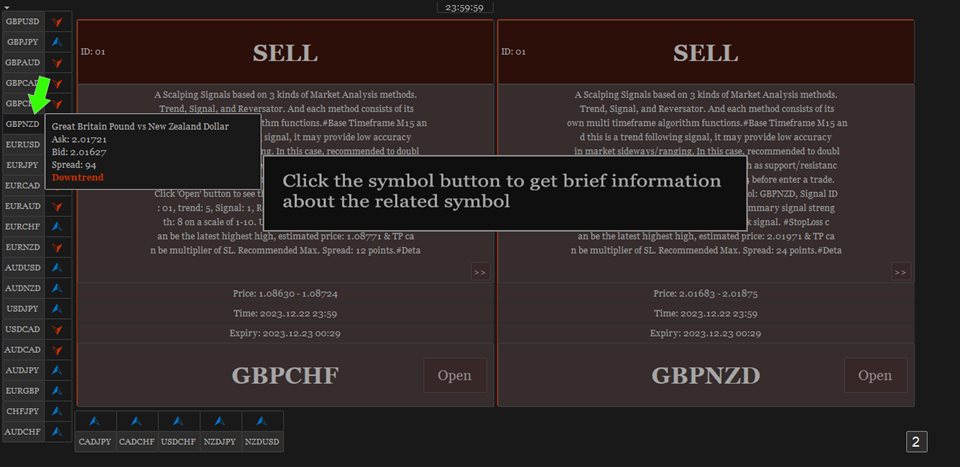
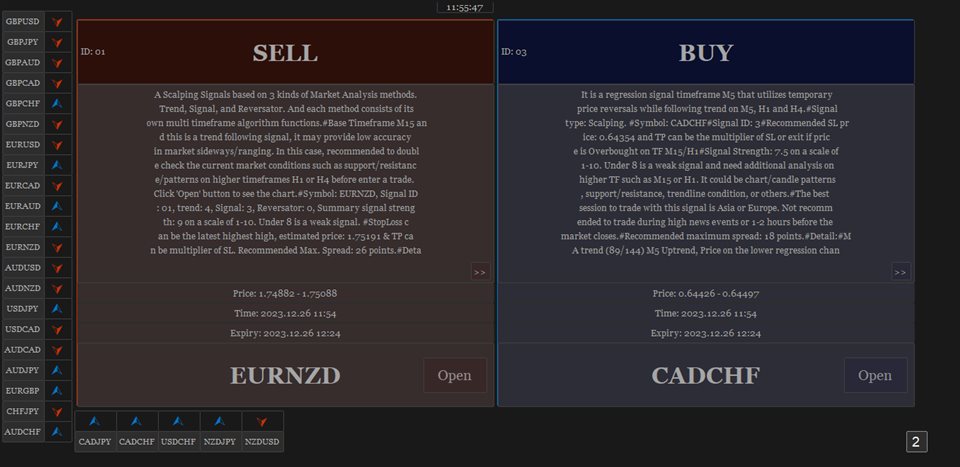
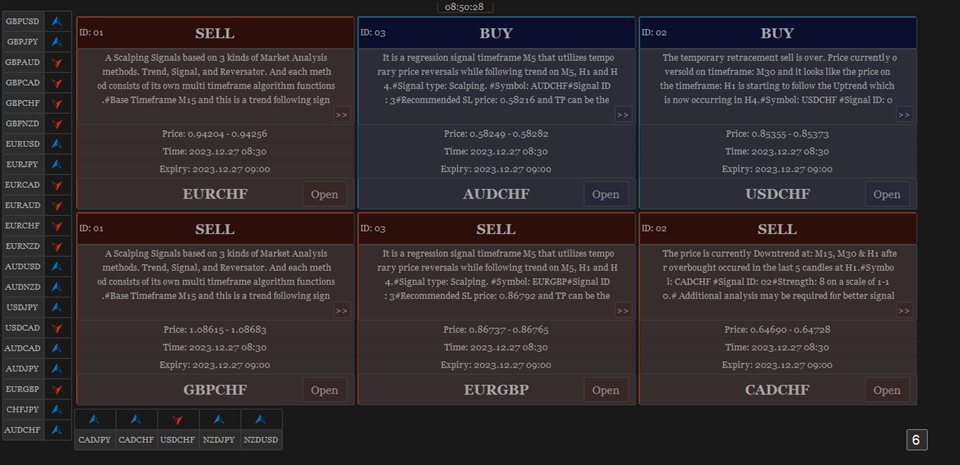
Provides instant signals on the chart in panel form. Equipped with signal description and trading analysis tools such as drawing auto trendlines, support/resistance area, regression channel, Fibonacci levels, Pivot levels and current signal price, signal time, signal expiry and stoploss recommendation. Also sending alert messages to all available mt4 alert tool.
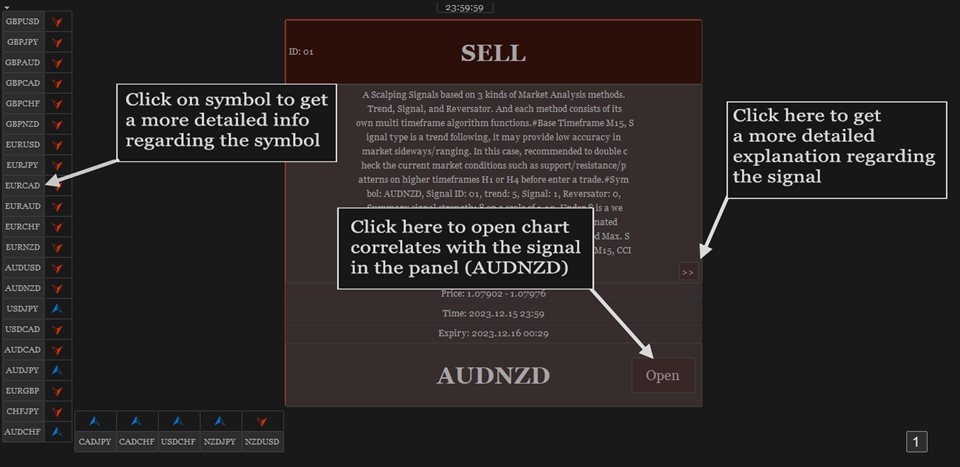
A detailed description panel provides information about where the signal comes from and what indicators are behind the signal. Including the suggestion that need to be considered before carrying out market execution. So that trader can draw conclusions and take necessary actions.
The Open Chart button to switch alternately between chart and panel, making it easier for trader to analyze chart directly based on signals currently available on the panel. The signals can be from various symbols, according to the desired input in the external parameter. Any symbols available in the market watch including forex, metal, indices, crypto, oil and futures.
The strategy behind the signals:
This is an important part of ChartGetSignal Indicator. It will display a signal on the panel when market conditions match the algorithm embedded in the indicator. Followed by an alert if enabled. The algorithms include Fibonacci retracement, regression, price action and custom trends. And several supporting indicators: MA, SAR, MACD, Stochastic, RSI, CCI and RVI. We combine them based on strategies that we consider having the highest potential to provide the next market direction. Including combining signals between timeframes to get confirmation from different period levels. The first step of the indicator is to detect the current trend from several required timeframes and then the second, finding a signal that matches the direction of the trend. Signals can come from price crossovers of several indicators and various timeframes, price action, crossovers at high-low prices or regression areas, the price is in the golden Fibonacci retracement area and is followed by a price that is oversold/overbought at a certain time frame and several other techniques to trigger signals. It is a complementary cross-strategy, cross-timeframe and cross-symbol signal scanner. Whichever signal is found first will be displayed on the panel and ChartGetSIgnal Indicator can display more than a signal at the same time on the chart.
How to trade:
We include a brief explanation of the signal on the panel with the aim of letting you know what is happening behind the signal. So, you make the right decision. You don't have to always follow existing signals because the market is very dynamic and requires improvisation at any time to suit current market conditions.
- It is highly recommended to read the explanation on the panel before executing the trade because here we provide some information regarding the signal such as a stoploss recommendation which describes the time range of the signal, the strategy inside the signal, spread and also suggestion that may need to be considered before taking a trading action.
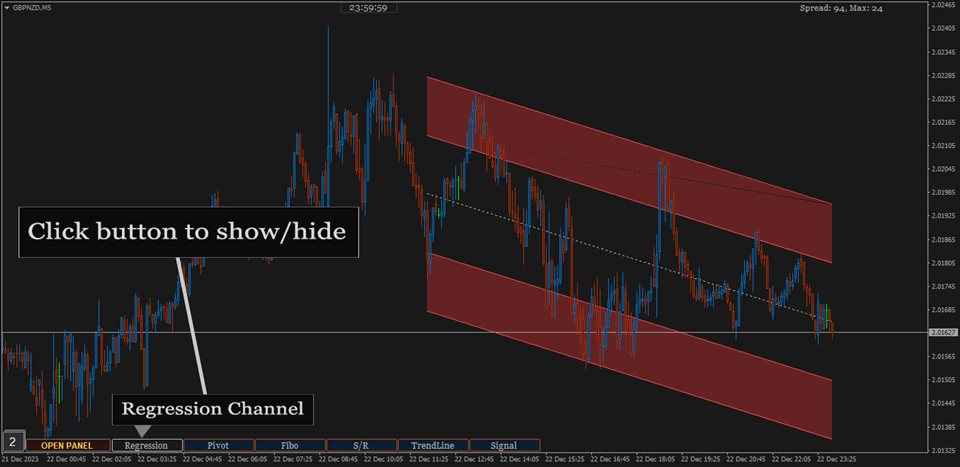
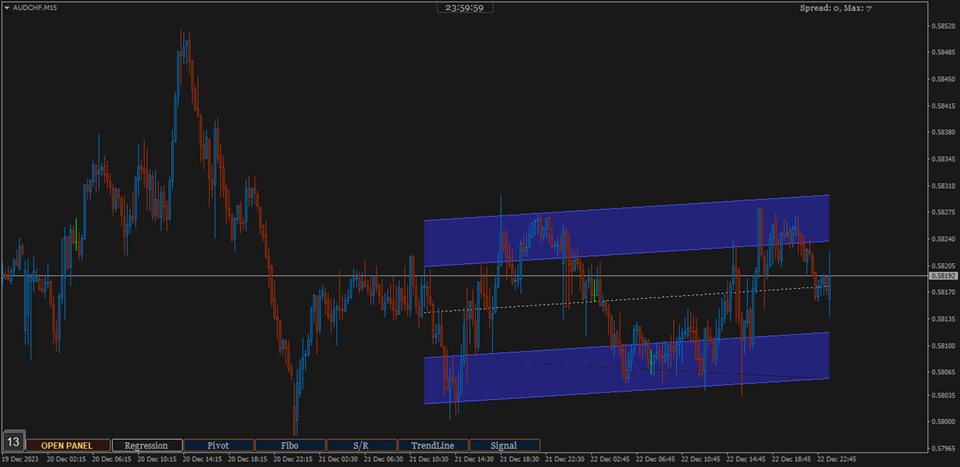
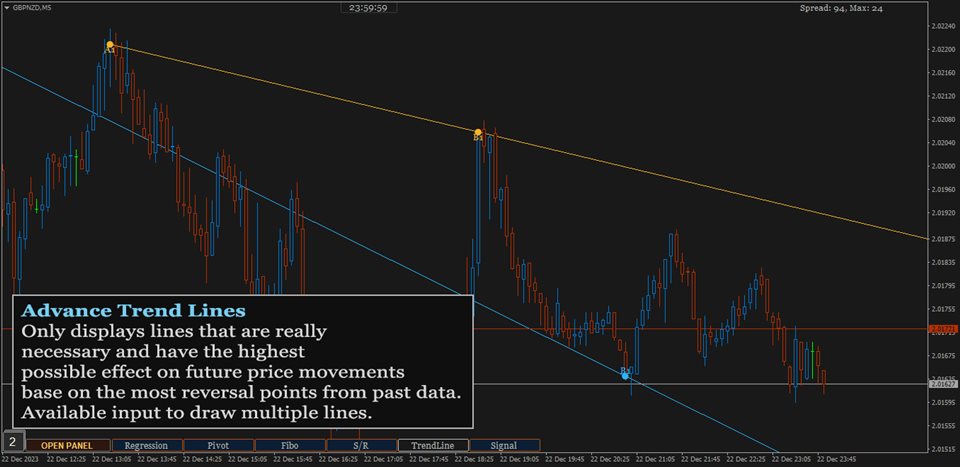
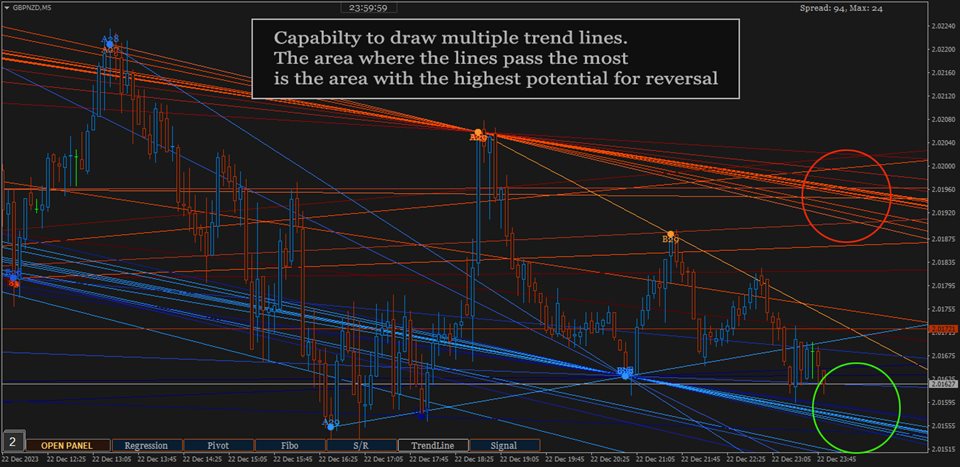
- Open the chart to perform additional analysis. Click the 'Open' button on the signal panel and by default, it will open the M15 timeframe with symbols related to the signal. Several analysis tools are available on the chart. Click buttons at the bottom to show/hide. Regression channel, Pivot levels, Fibonacci Retracement level, Support/Resistance areas, Trendlines, and also the Signal itself which contains information about the direction, entry price range and stoploss. Take advantage of them to find out the current price position. Make changes to the parameters of those tools like the Trendline and Support/resistance parameter if necessary. You can also put your own indicators to strengthen the confidence of your decision.
- Look at Support and Resistance from different timeframes - especially on higher timeframes - to determine more accurate take profit or stop loss. Because the exit is as important as the entry itself.
- You can cancel the execution in case you see the price is in the opposite Support/Resistance area or the price is Oversold/Overbought. Because the indicator does not accommodate all current market conditions. It will produce very few signals in the same time span in case we do it. For that reason, we set a scale to display the signal. If the minimum scale, we specified in the code is met then the signal is triggered. The scale value can be read on the description panel.
- Use proper trading and money management. Adjust to your account condition.
Parameters:
- Trading Symbols (separated by comma): input the symbol to be scanned. It can be any symbol and should be the symbols available in the market watch.
- Symbol Prefix: The symbol prefix if available. Otherwise leave it blank.
- Symbol Suffix: The symbol Suffix if available. Example: EURUSD.s, then the suffix is .s
- Signal Storage Time in minute (min. 15): The indicator will store and maintain the signal on the panel for the time period specified here. Minimum Value is 15 that means 15 minutes.
- Support/Resistance Period: The indicator will look for reversal points at every number of bars specified here until up to 1000 bars back. And it will draw Support/Resistance area based on the data.
- Support/Resistance Strength: This value is the minimum number of reversal points - highest high and lowest low - in the past that the indicator must count to display Support/Resistance area. The idea is that the higher the number, the higher the probability of a reversal in the future. If the entered value is not found in the existing history, the indicator will not display Support/Resistance area. So, the lower the value entered, the more Support/Resistance areas will possibly be displayed and vice versa.
- Bars to search TrendLines: This is the maximum number of bars that the indicator must count to display a trendline. Within the range of bar values specified here, the indicator will look for the most relevant points and the most frequent price reversals to draw trend lines.
- TrendLines Period: This is similar to point 5 above. But this is to determine the trend line. The indicator will look for reversal points at every number of bars specified here until up to the number of 'Bars to search TrendLines' specified in point 7.
- Max. Trendlines/Side: The indicator can display more than one line per 'up/down' side based on the values specified in points 7 and 8 above. With the condition that trend line is found based on the input above. Maximum value of this input is 30 for performance reason.
- Bars Multiplier: It is the multiplier of the value of ' Bars to search TrendLines' (point 7). This value will be used only if ' Max. Trendlines/Side' specified in point 9 is more than 1. The formula is Bars to search TrendLines x line index x Bars Multiplier. Example: Bars to search TrendLines= 300, Max. Trendlines/Side= 4 and Bars Multiplier= 2 then the indicator will draw the trend lines with such conditions:
- The first 2 lines (upper & lower) are drawn from the calculation of the last 600 bars. 300 x 1 x 2
- The second 2 lines (upper & lower) are drawn from the calculation of the last 1200 bars. 300 x 2 x 2
- The third 2 lines (upper & lower) are drawn from the calculation of the last 1800 bars. 300 x 3 x 2
- The fourth 2 lines (upper & lower) are drawn from the calculation of the last 2400 bars. 300 x 4 x 2
- And so on, if 'Max. Trendlines/Side' is added more in value.
- Trendlines width: The width of trend lines.
- Fibo Period: Number of bars to calculate the Fibonacci Retracement Levels.
- Shape Fibo Golden Ratio: Option to draw background color in the Golden Ratio area for Fibonacci Retracement Levels.
- Pivot Levels Timeframe: Option Timeframe to draw Pivot Levels. The Levels are drawn from the data of the last candle close of the timeframe specified here.
- Regression Fast Period: The Fast period of MA to determine the trend in regression signals.
- Regression Slow Period: The Slow period of MA to determine the trend in regression signals and also this is the number of bars to calculate the regression channel.
- Regression Deviation: The deviation of regression channel.
- Bar Up Color: The color of bar up.
- Bull Candle Color: The color of bull candle.
- Bear Candle Color: The color of bear candle.
- PopUp Alert
- Mobile Notification Alert
- Email Alert
Below are the candle color settings when the chart is opened:
Indicator alerts:
FAQS
- How many signals does the indicator generate per day? *The average signal generated can be up to 50 signals per day and depends on market conditions. Minimum 10 per day. With the assumption that MT4 is online 24 hours.
- The indicator displays error text on the chart, what should I do? *The indicator will automatically download history data if the existing data is insufficient to generate a signal. It will display an error message when downloading the data. Wait a few moments until the download is complete. Make sure you write the input symbols correctly, including prefixes and suffixes and comma as symbol separator.
- Why can't indicators be attached to charts? *It will be automatically removed from the chart if a mistake in inputting the symbol is found or the symbol is not available on market watch. Try to check again the symbol input.
- This indicator makes my MT4 run slowly, what should I do to improve its performance? *Normally, it should not happen. Because we took that into consideration when building this indicator. However, if that happens, try changing some of the overloading parameters. For example: reducing the number of symbols or the 'Max. Trendlines/Sides'.
- What does the ID displayed on the signal panel mean? *There are several trading strategies behind the signal and the ID is to mark the strategy. Each strategy has its own ID.
- What time zone is used in this indicator to determine the time and expiration of the signal? *It uses Time Server.
- How much minimum capital is required to trade with this indicator? *You can use as much capital as you want according to the rules applied by your broker. There is no minimum limit.
- Will you make updates in the future, including adding trading strategies? *Of course. I will make regular updates, if necessary, as I also do with my other products.
- Is it possible to use the signals to apply to EA? *Yes, possible. ChartGetSignal save the signal to file txt, everytime new signal is triggered. Real time updated. You can use it to apply to the EA.
If you have any question, please don't hesitate to contact me.










its been a while with no response to a question about a indicator I bought