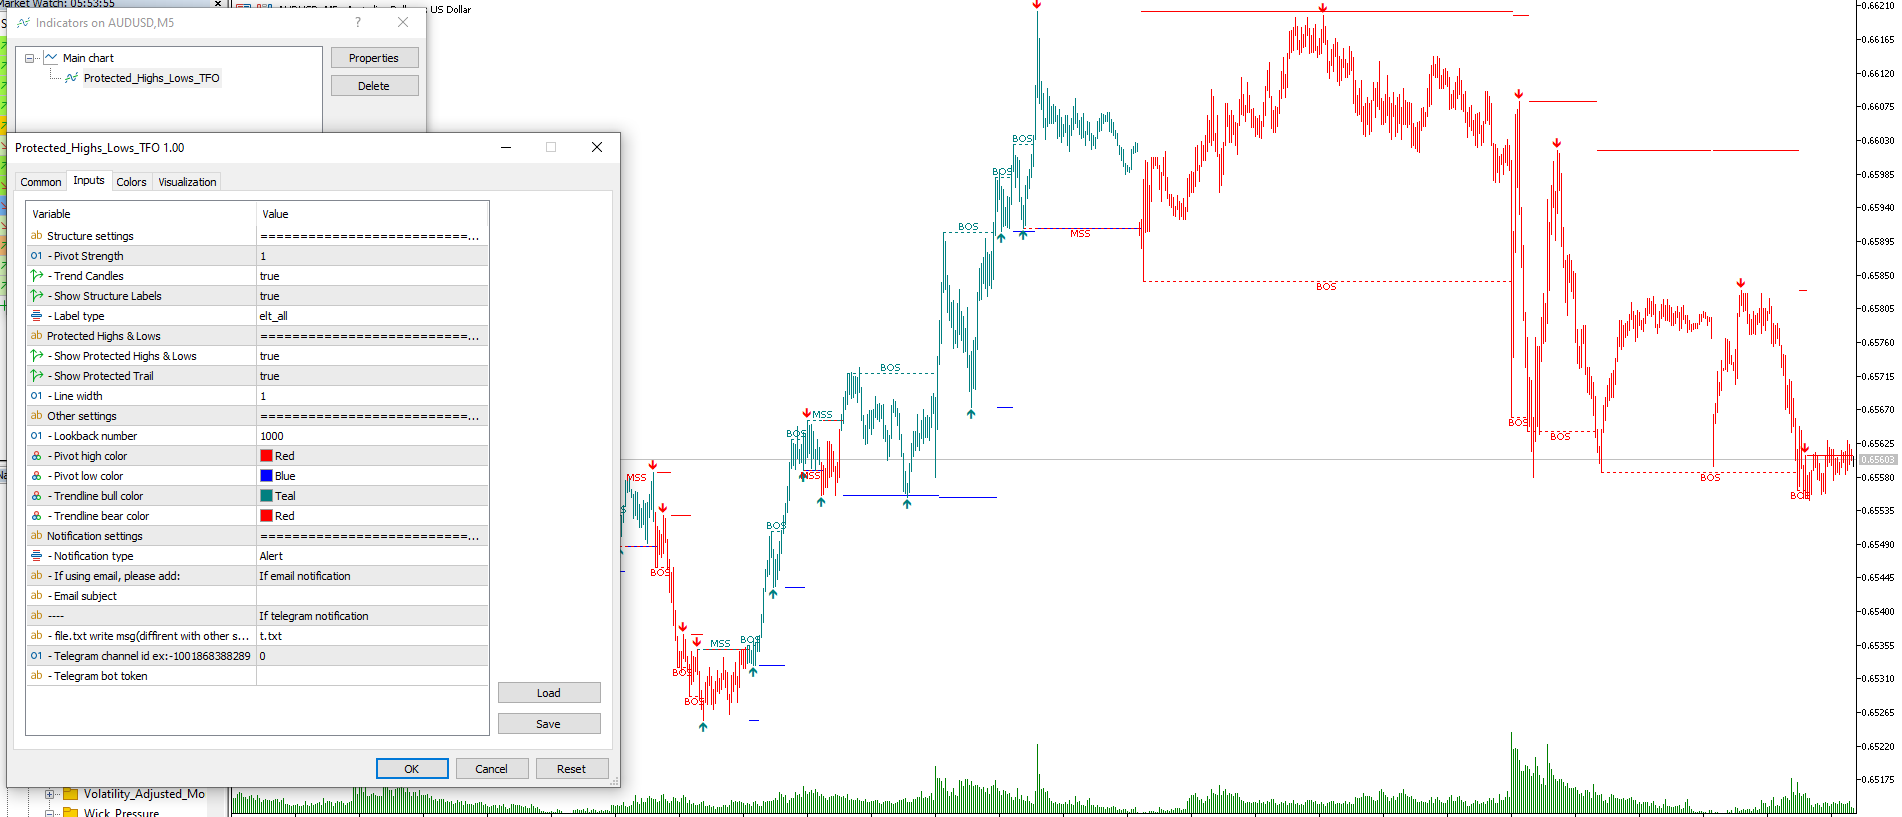
Protected highs lows and trend detected
- Indicatori
- Minh Truong Pham
- Versione: 1.10
- Aggiornato: 31 dicembre 2024
- Attivazioni: 5
This indicator presents an alternative approach to identify Market Structure. The logic used is derived from learning material created by DaveTeaches (on X)
Upgrade v1.10:
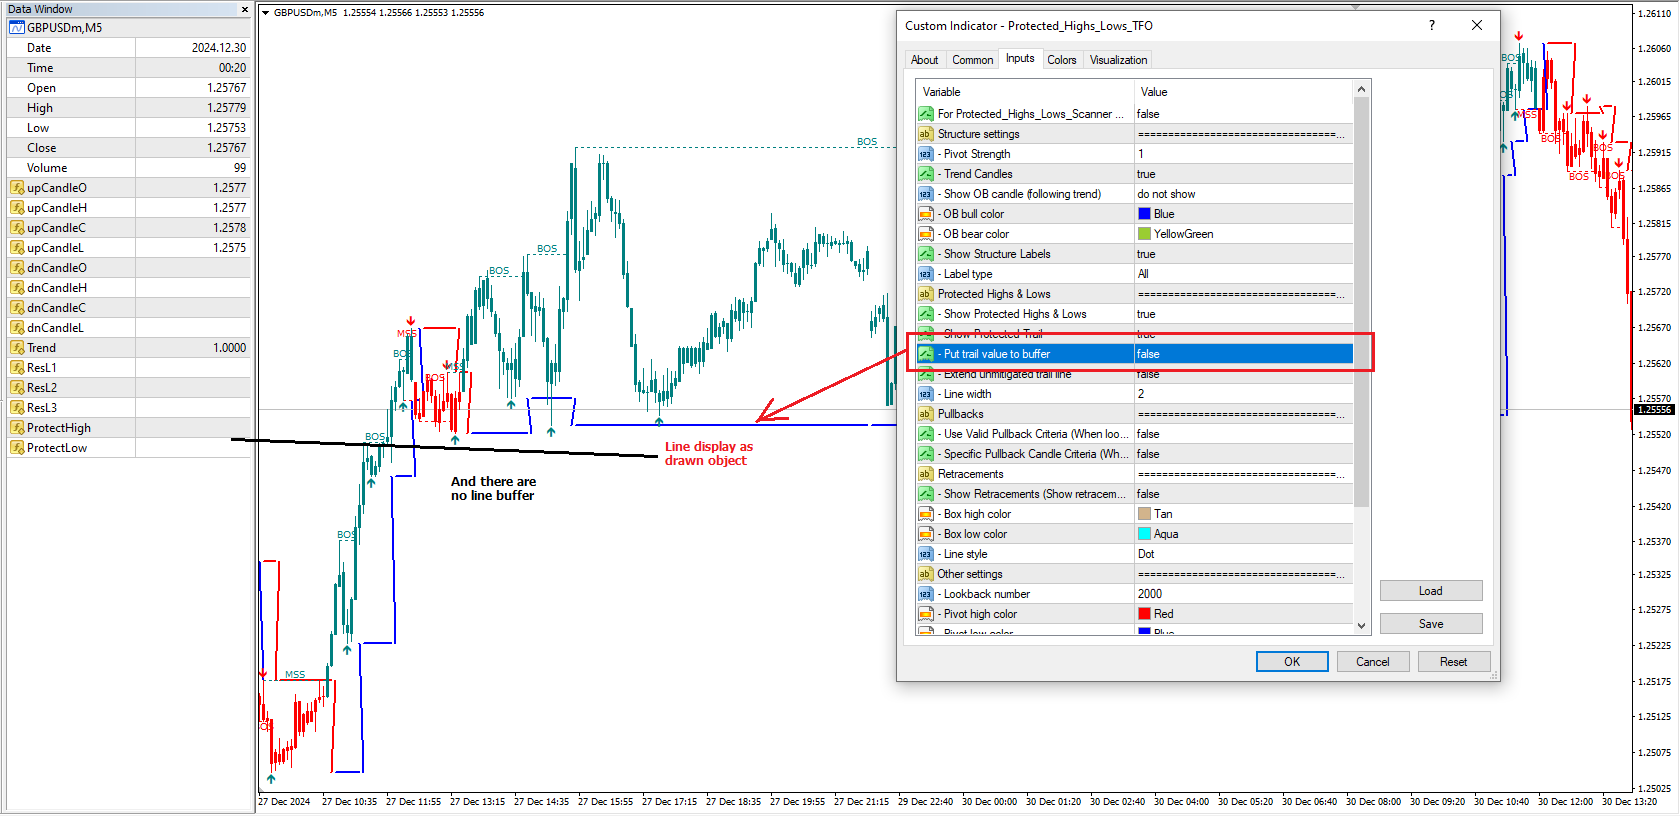
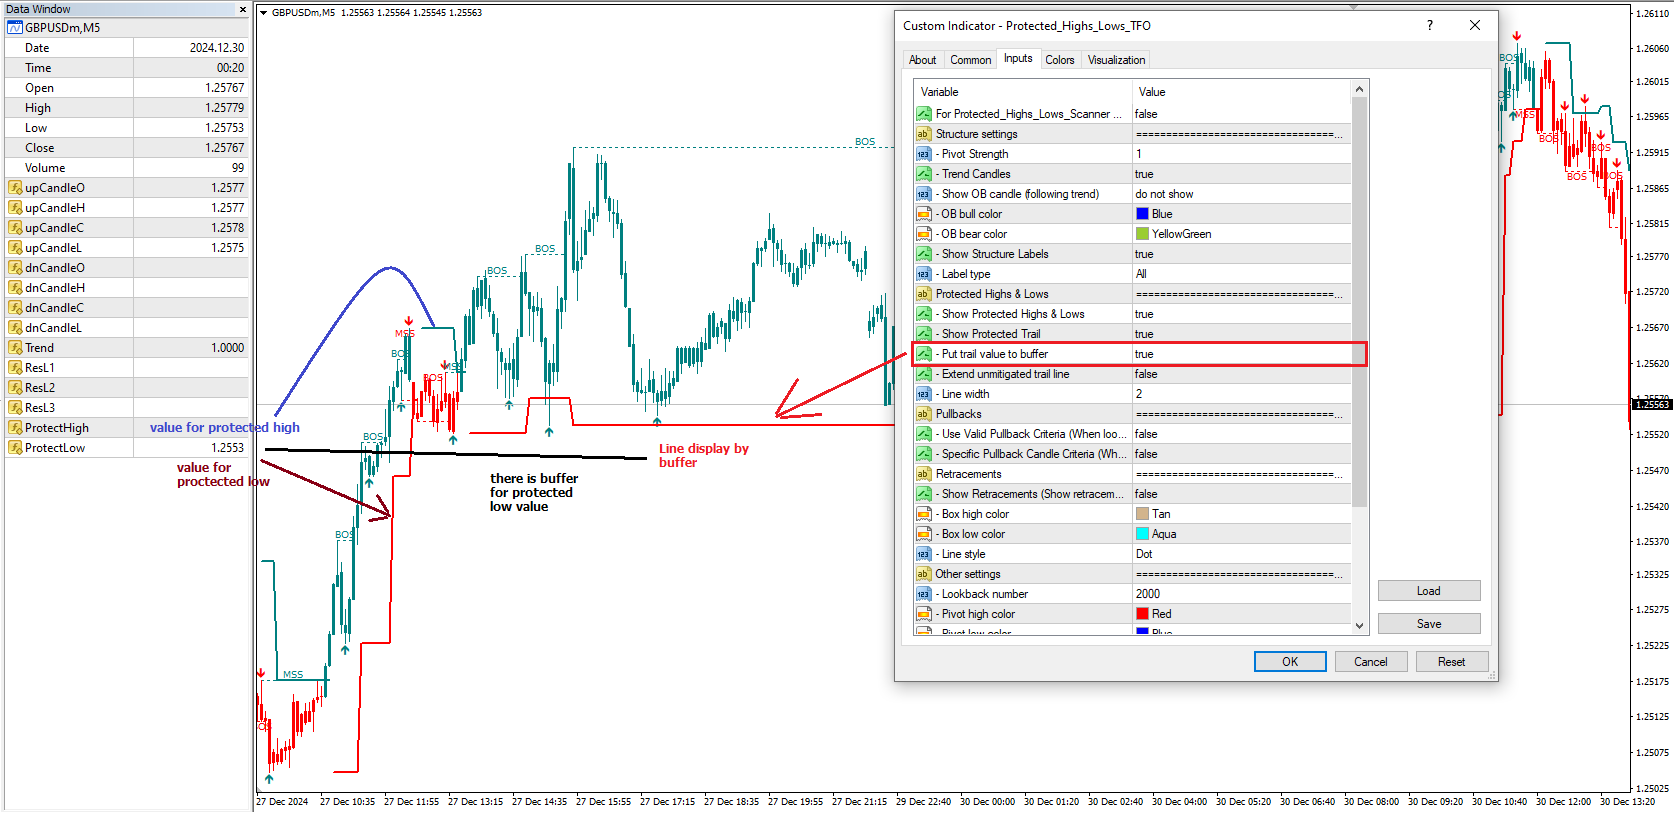
+ add option to put protected high/low value to buffer (figure 11, 12)
+ add Retracements value to buffer when Show Retracements
When quantifying Market Structure, it is common to use fractal highs and lows to identify "significant" swing pivots. When price closes through these pivots, we may identify a Market Structure Shift (MSS) for reversals or a Break of Structure (BOS) for continuations. The main difference with this "protected" logic is in how we determine the pivots/levels that are utilized to determine a valid MSS or BOS.
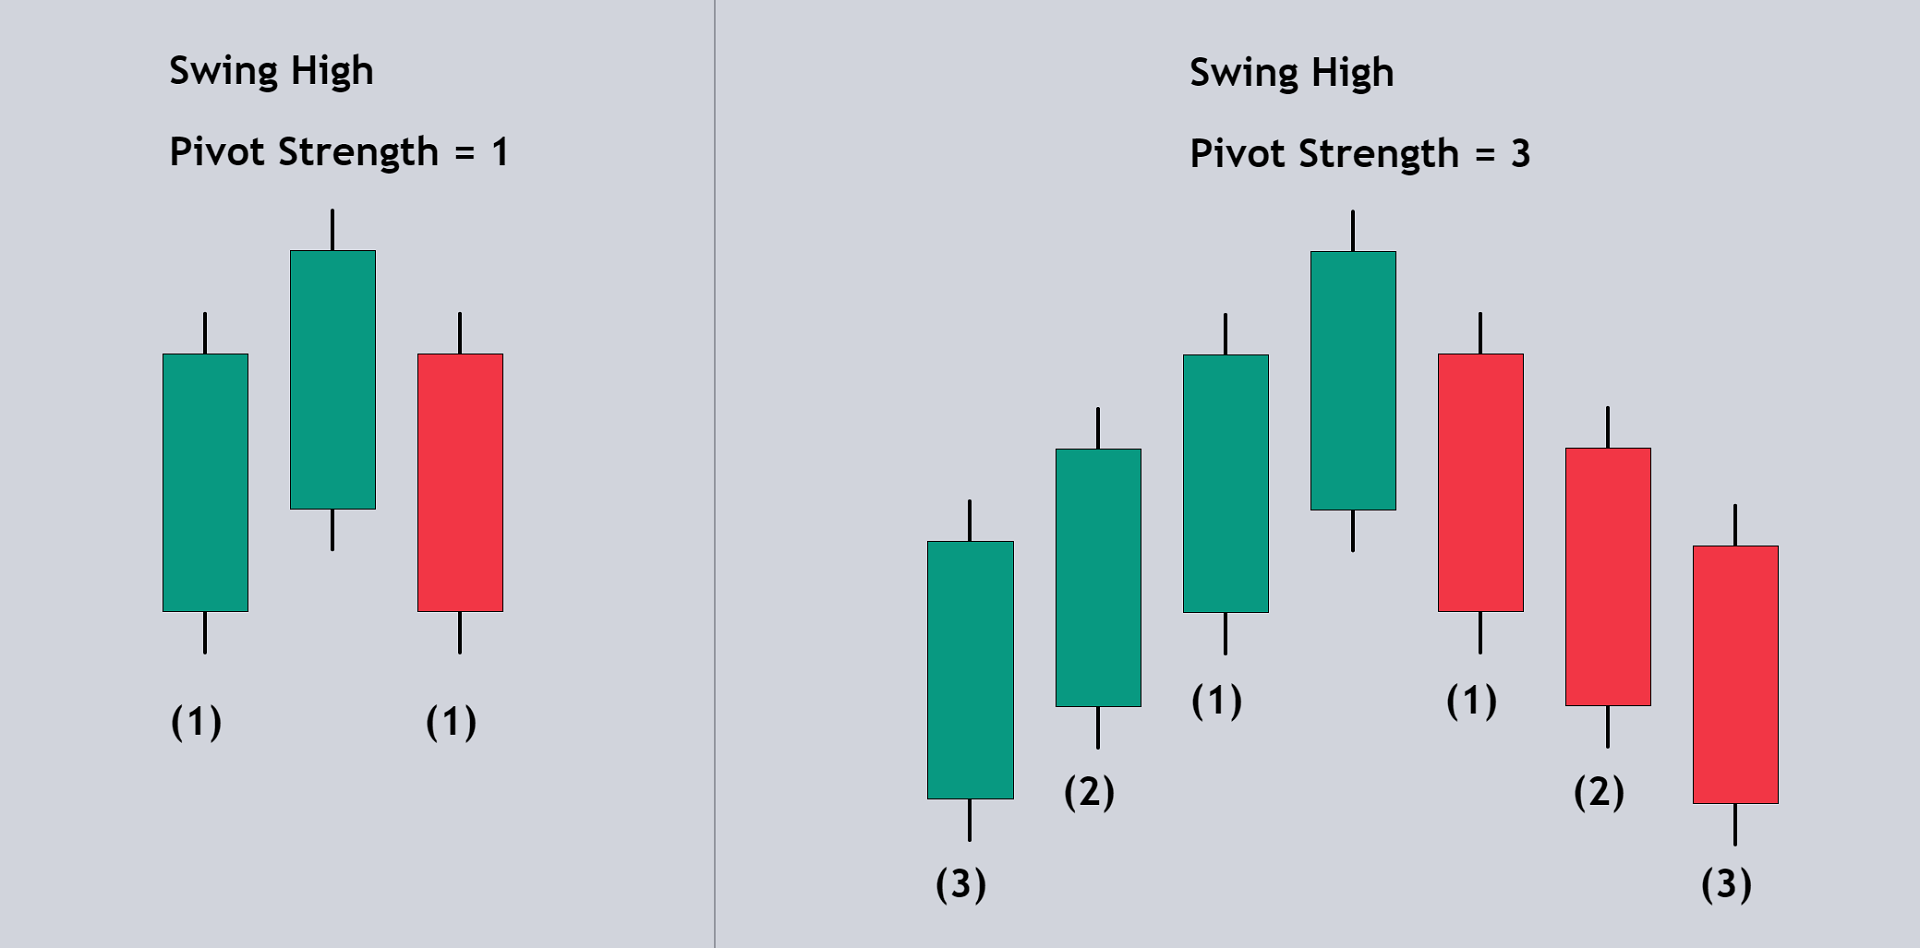
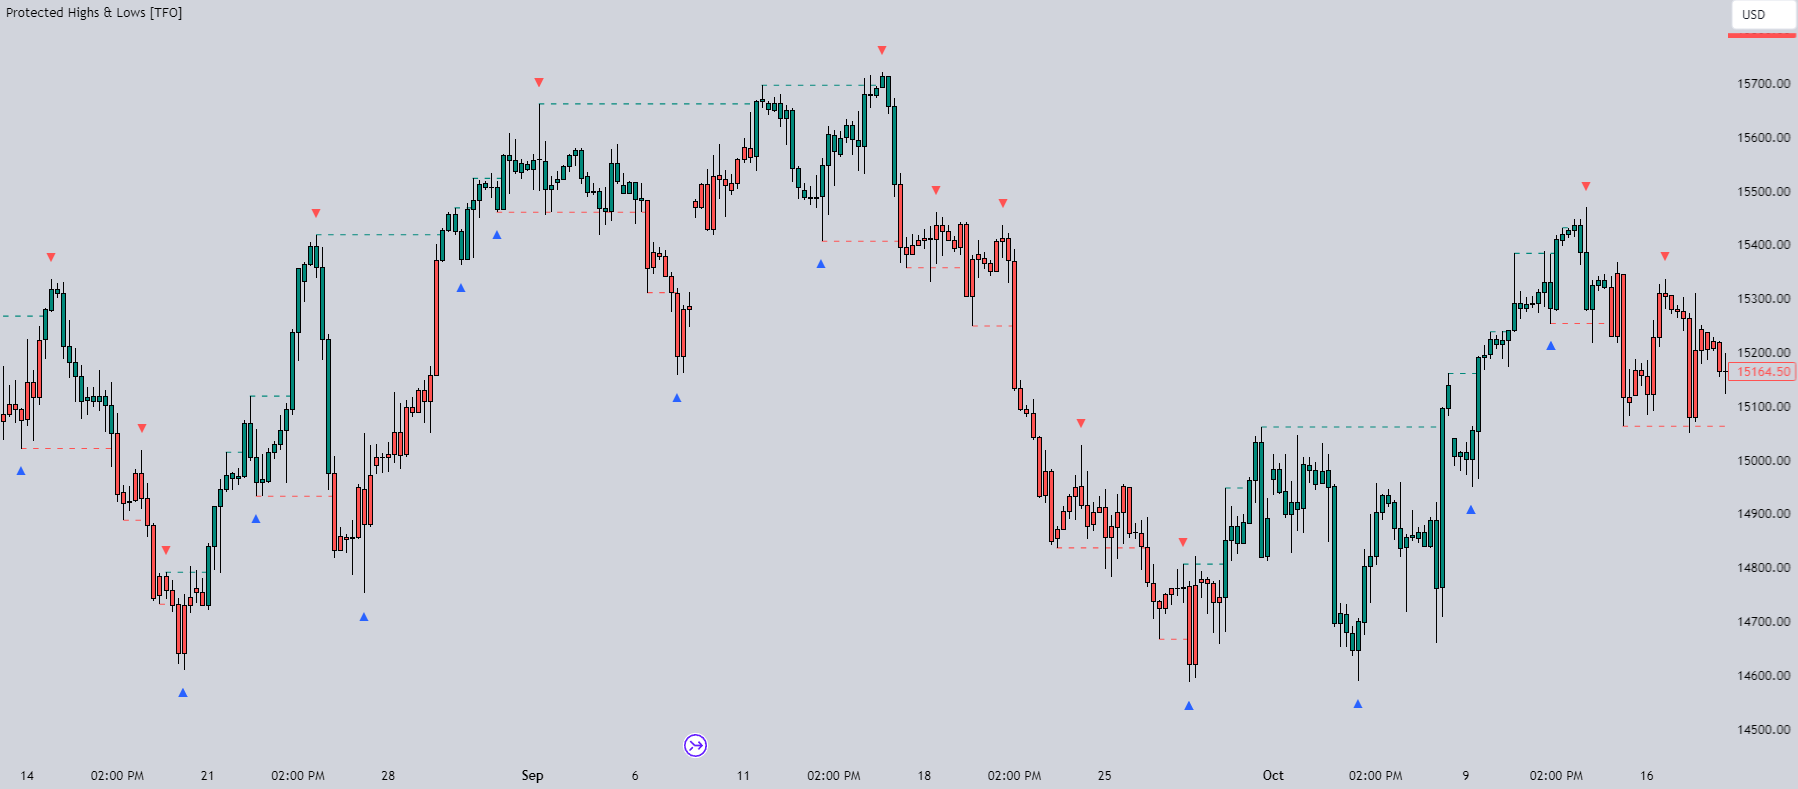
Nonetheless, the significance of our swing pivots is still governed by the input Pivot Strength parameter, which requires valid swing pivots to be compared to this many bars to the left and right of them. This is an optional parameter as it is traditionally set to 1 by default. (Image 2)
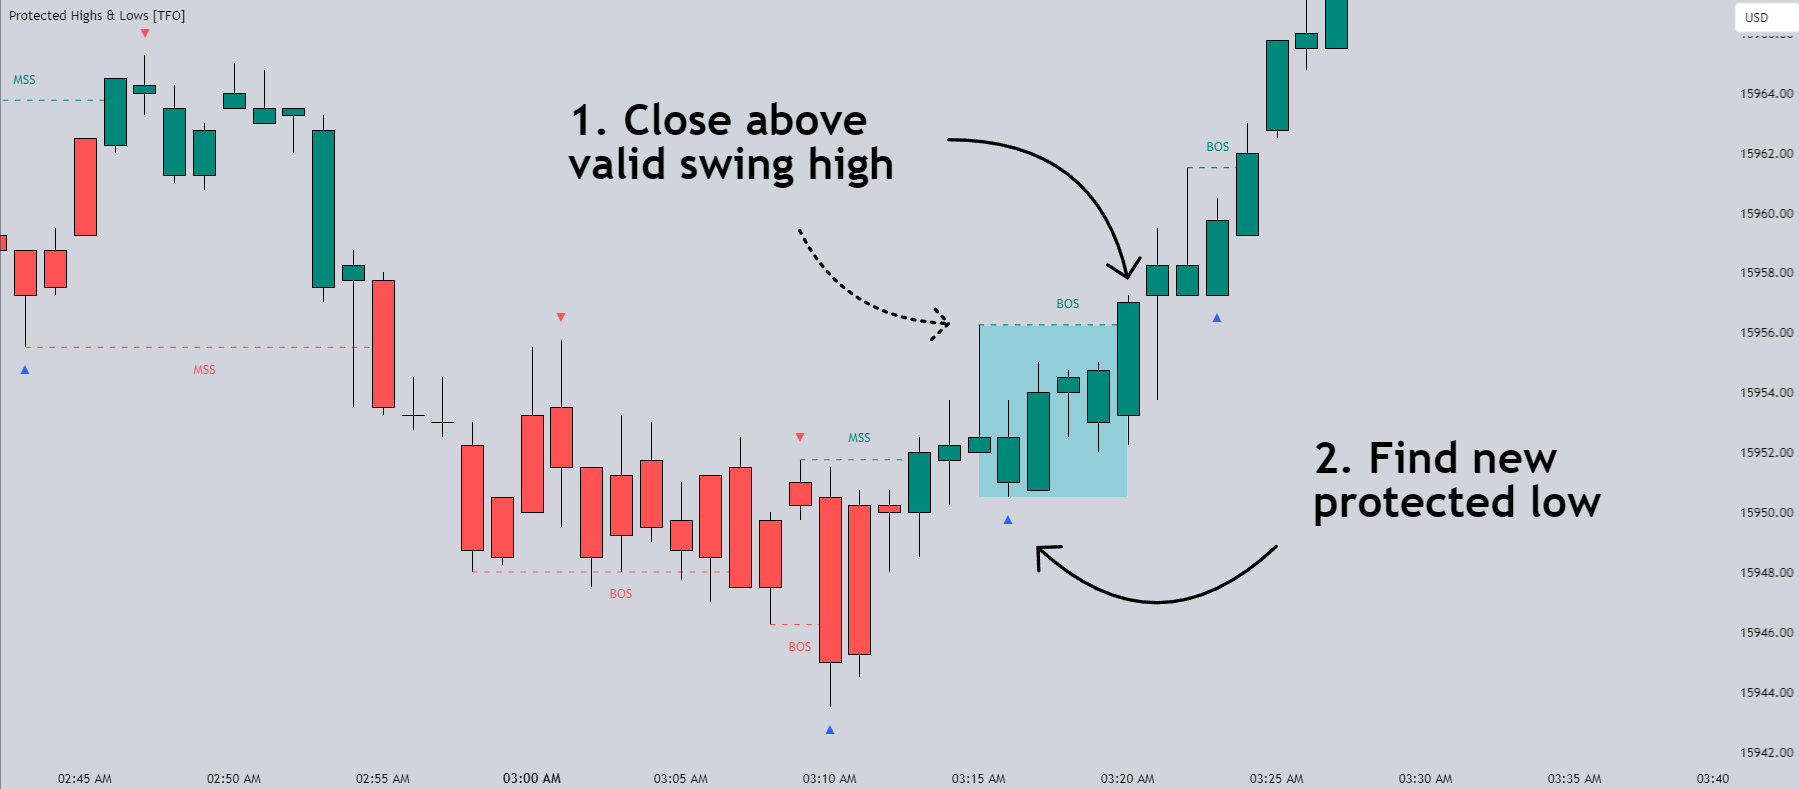
When identifying a BOS: When price closes below a valid swing low, we look back from the current bar to find the highest high that was made in that range. This becomes our protected high; similarly, when price closes above a valid swing high, we look back from the current bar to find the lowest low that was made in that range, which then becomes our protected low.
Note these valid highs and lows are the first swing pivots created after a MSS/BOS. For example, when price makes a bullish BOS/MSS and then trades away, a swing high is formed. This first swing high is what needs to be traded through to see a valid BOS. (Image 3)
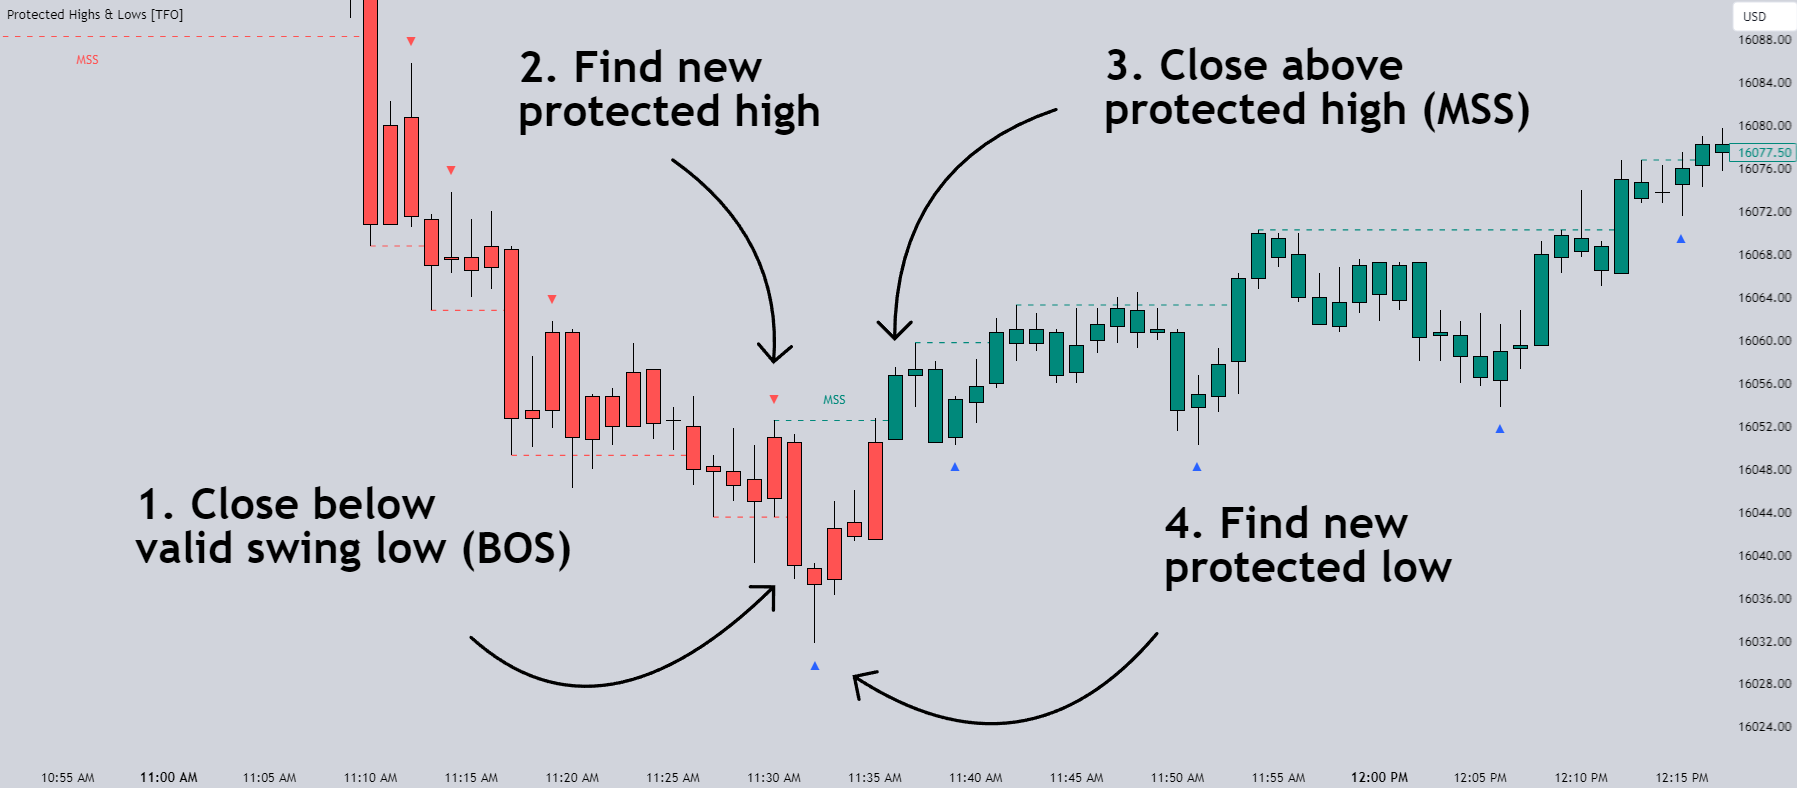
When identifying a MSS: If the current trend is bearish and we're looking for a bullish reversal, we would need price to close above the most recent protected high. When this happens, we still look back to find the lowest low that was created in that range, and make that our new protected low. Likewise when looking for a bearish reversal, price would need to close below the most recent protected low, which would then give us a new protected high as a result (the highest point in that range). (Image 4)
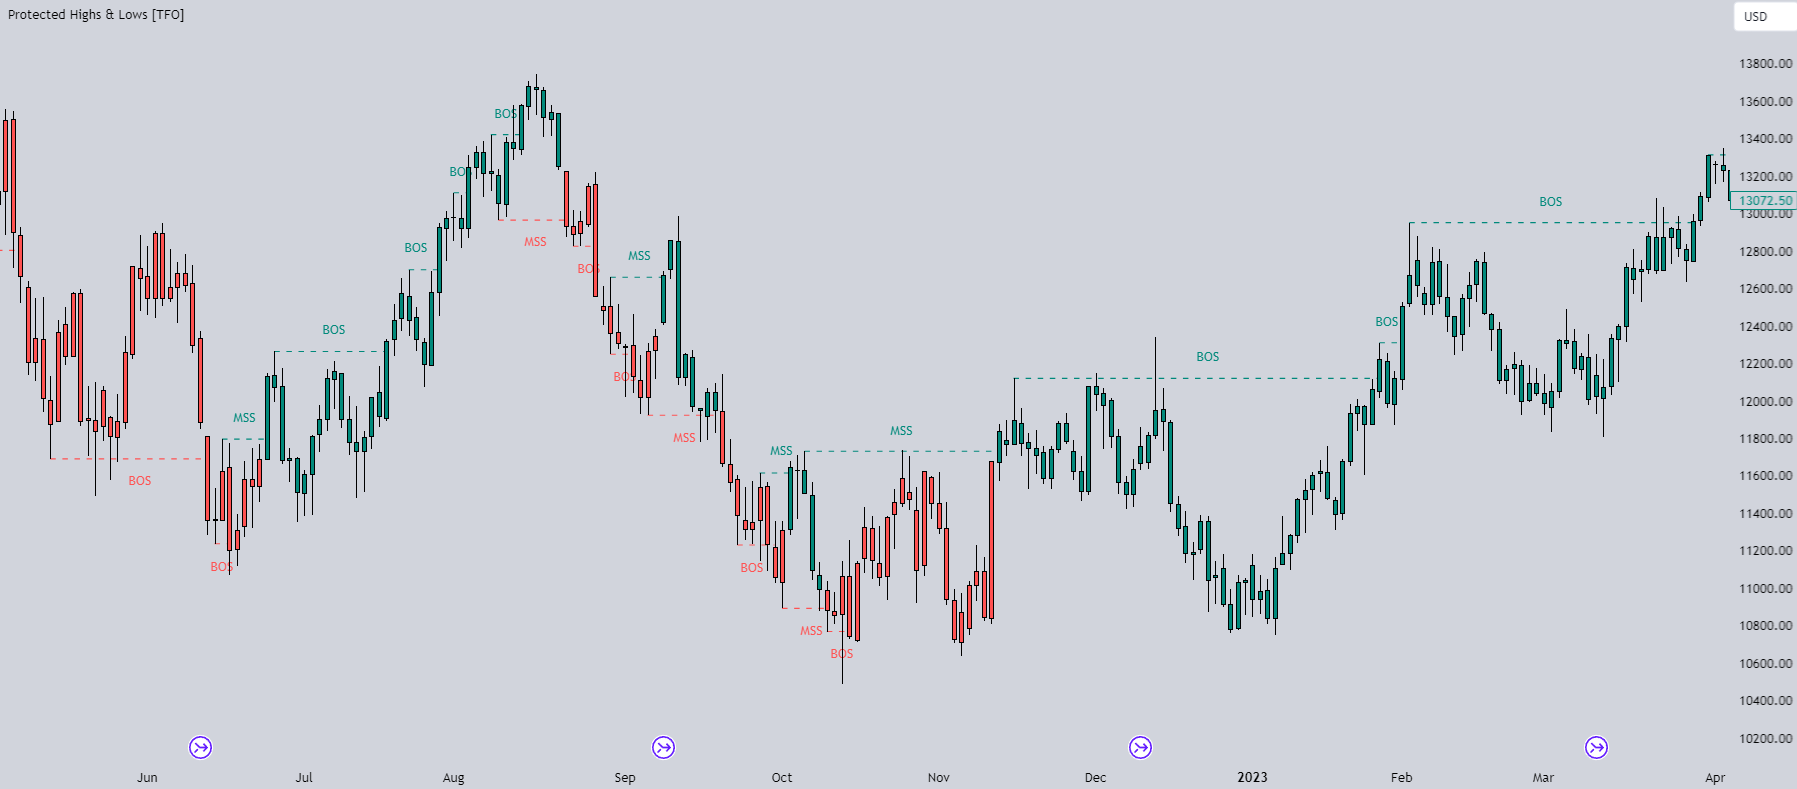
The Trend Candles option allows users to easily visualize the current state of Market Structure with bullish and bearish colors. Users may also show BOS and MSS labels if desired. (Image 5)
Show Protected Highs & Lows will annotate the protected highs and lows, just note that the labels themselves are plotted in the past due to the lookback function required to identify them. (Image 6)
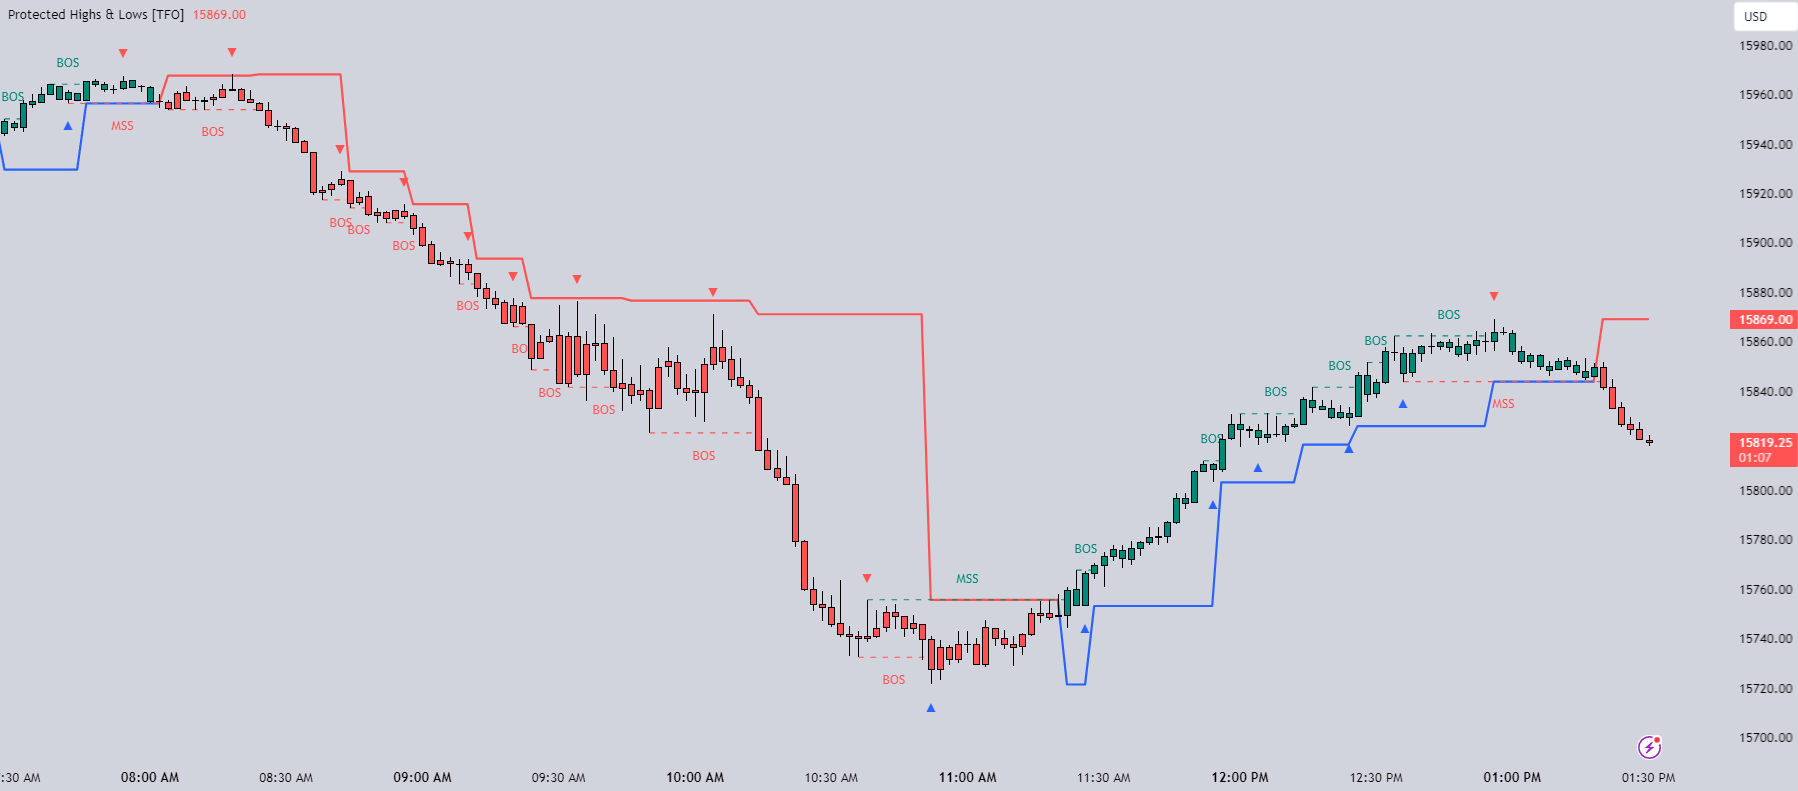
Lastly, the Show Protected Trail option will draw a line to essentially indicate a trailing stop-like line to denote the most recent protected low (if bullish) or protected high (if bearish). (Image 7)
Upgrade
From v1.2 client can easily read trend from this ind via buffer to build scanner or EA. Everyone can download free scanner (with sourcecode) at here
+ Setting "For Protected_Highs_Lows scanner" should be false at visualization mode.
From v1.8
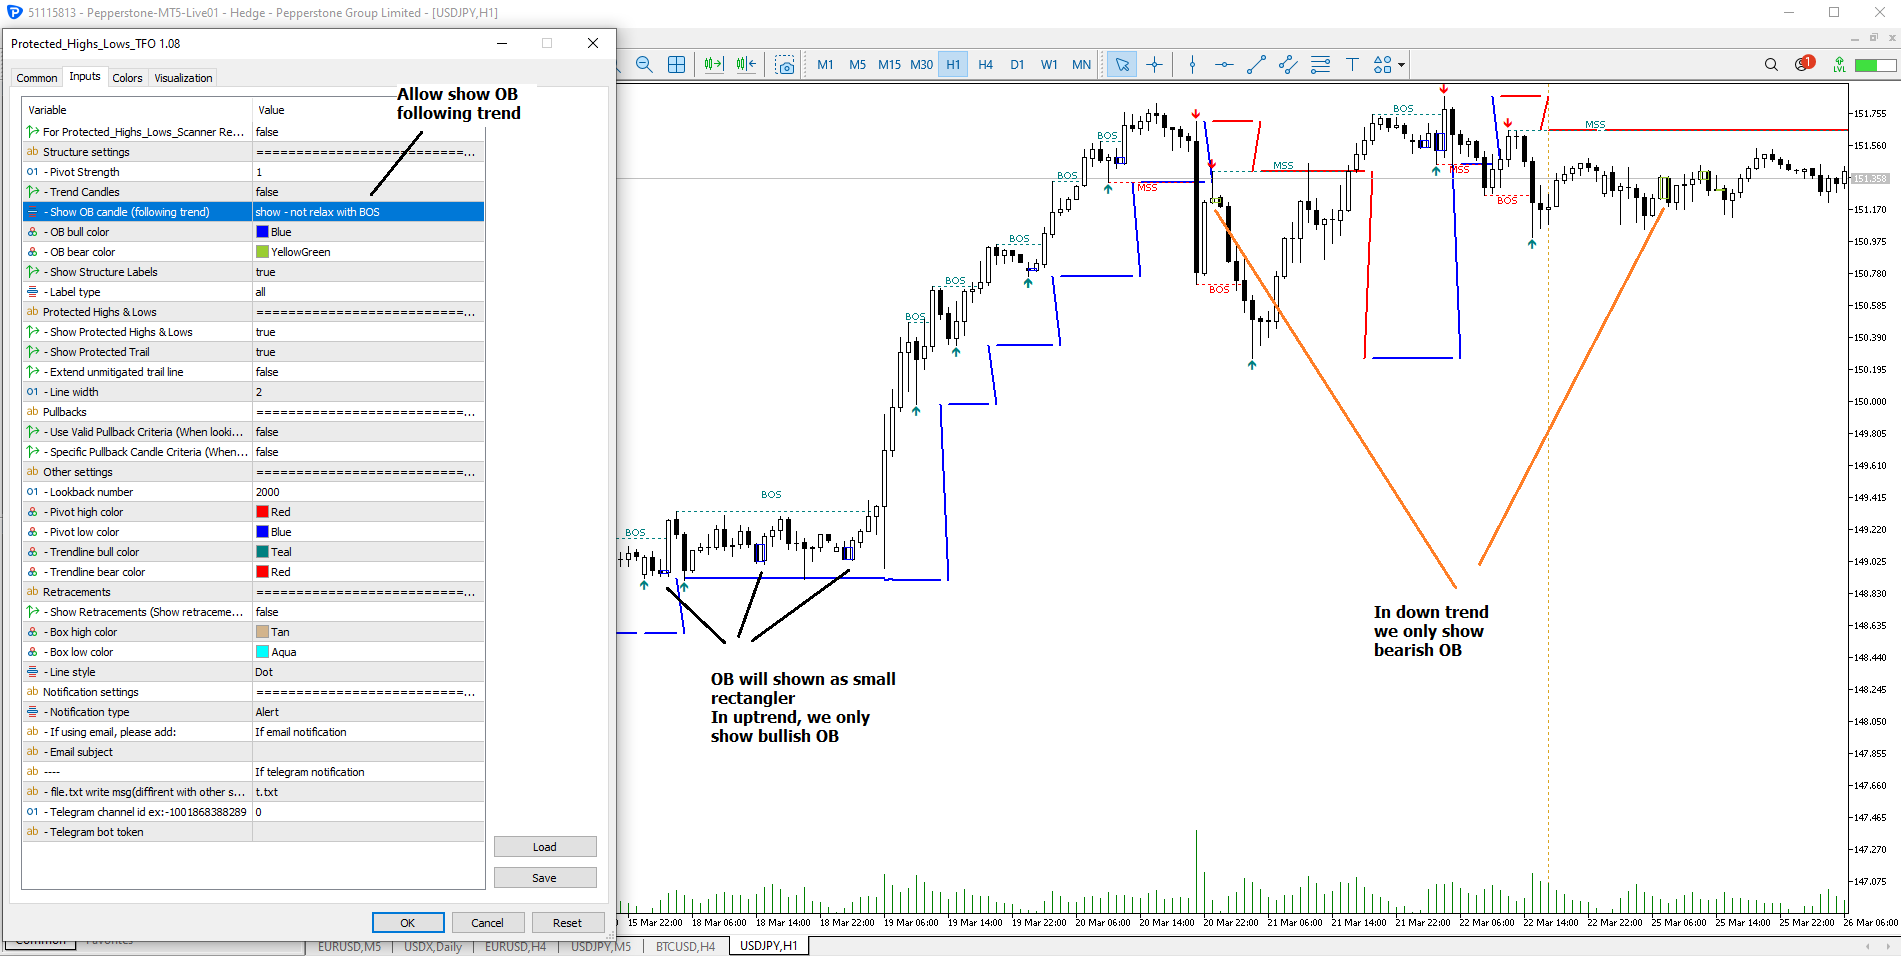
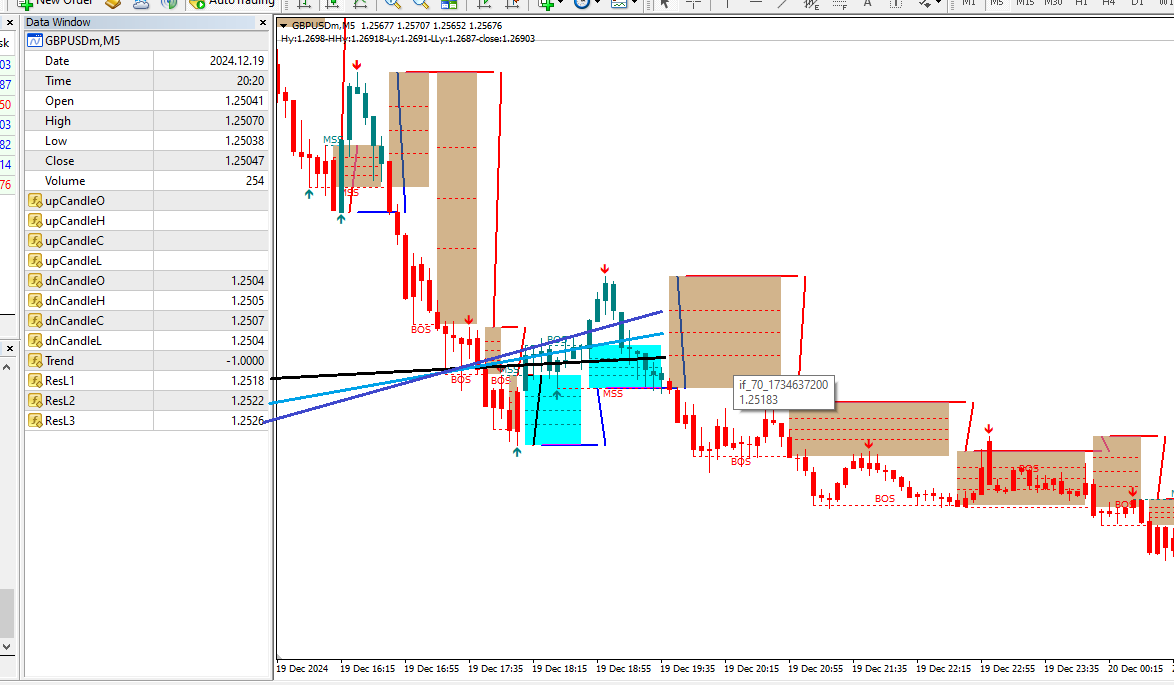
1. Added new function to display Order block according to trend: (image 8)
+ Up trend => display just bullish OB
+ Down trend => display just bearish OB
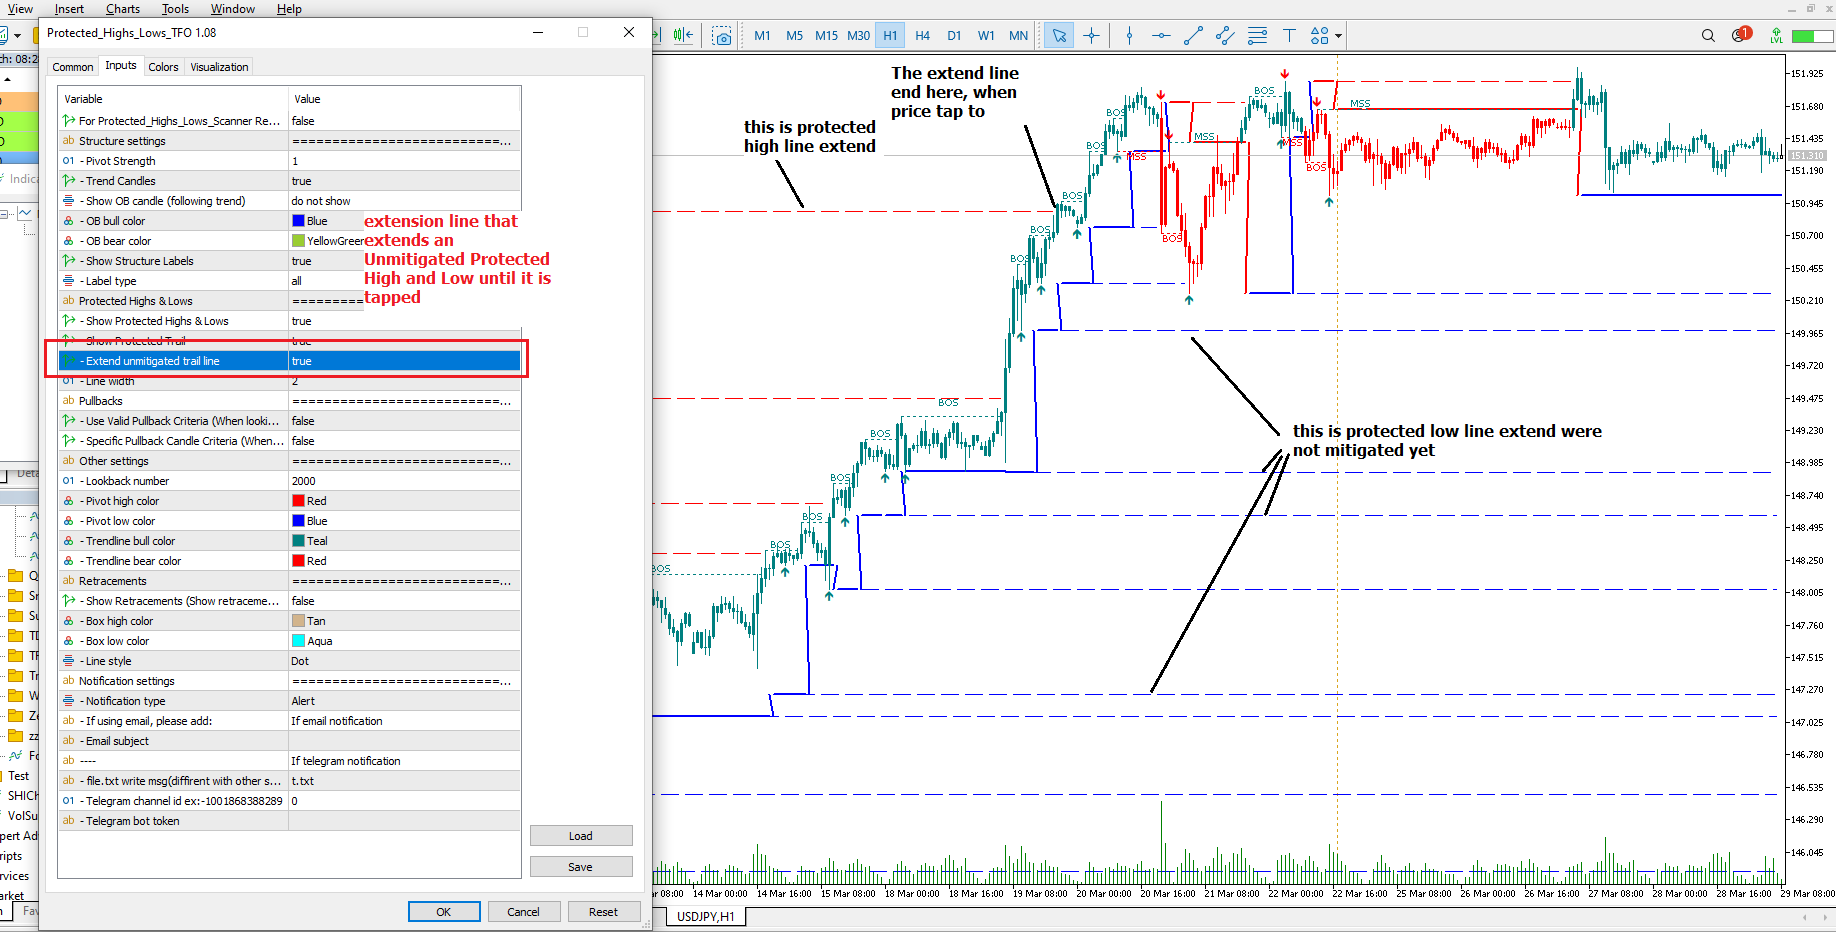
2. Add feature by an extension line that extends an Unmitigated Protected High and Low until it is tapped (image 9)