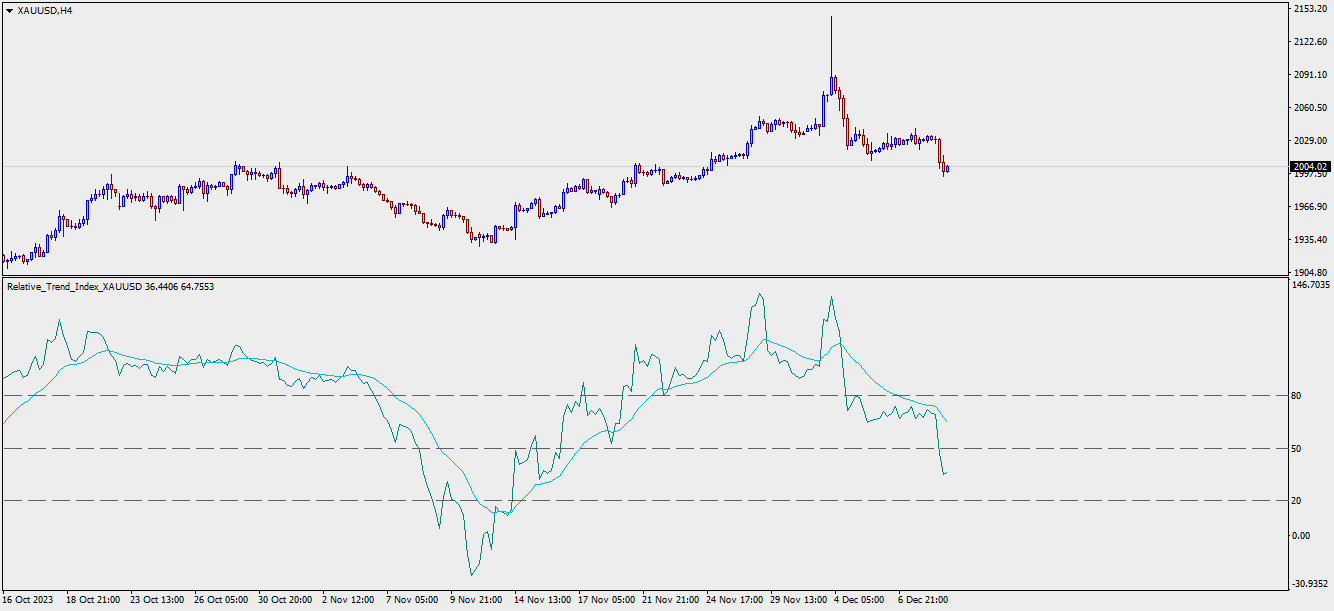
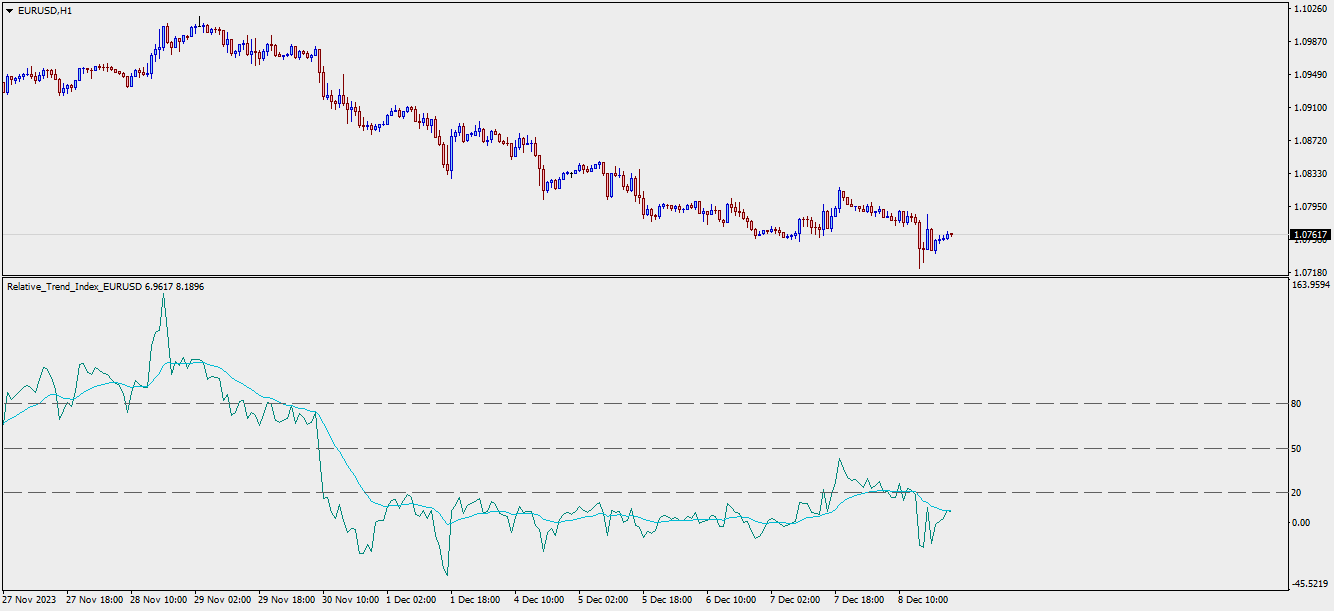
Relative Trend Index
- Indicatori
- Mahdi Ebrahimzadeh
- Versione: 1.0
- Attivazioni: 5
L'indicatore viene tradotto da un altro linguaggio di programmazione a MQL. RTI è un potente pedaggio per identificare la tendenza del grafico in modo oscillatorio.
Ecco alcune note del programmatore originale:
Panoramica
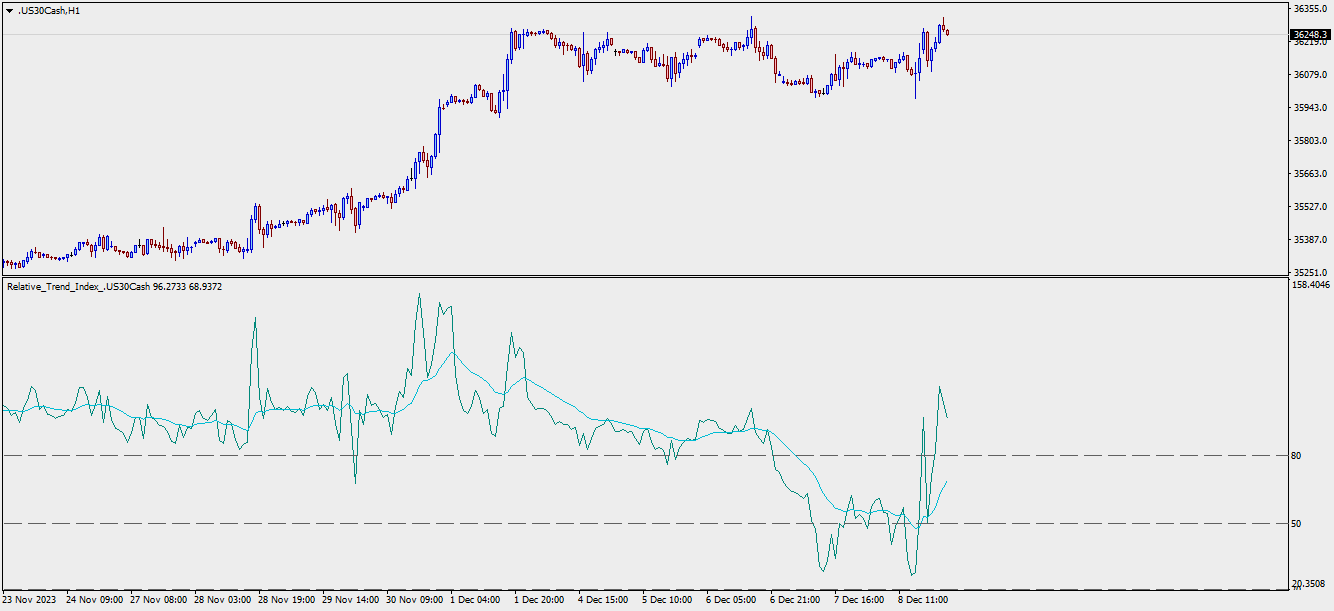
Il Relative Trend Index (RTI) sviluppato da Zeiierman è un innovativo strumento di analisi tecnica progettato per misurare la forza e la direzione della tendenza del mercato. A differenza di alcuni indicatori tradizionali, l'RTI vanta una capacità distintiva di adattarsi e rispondere alla volatilità del mercato, minimizzando al contempo gli effetti delle fluttuazioni di mercato minori e a breve termine.
Il Relative Trend Index combina le caratteristiche di trend-following e mean-reverting con un approccio intuitivo e personalizzabile alla forza del trend, e la sua sensibilità all'azione dei prezzi lo distingue.
Vantaggi dell'utilizzo di questo RTI al posto dell'RSI
Il Relative Strength Index (RSI) e il Relative Trend Index (RTI) sono entrambi potenti indicatori tecnici, ciascuno con i propri punti di forza.
Tuttavia, vi sono differenze fondamentali che rendono l'RTI probabilmente più sofisticato e preciso, soprattutto quando si tratta di identificare le tendenze e le aree di ipercomprato/ipervenduto (OB/OS).