Quick Drawing Tool
- Indicatori
- Ao Shen
- Versione: 3.88
- Aggiornato: 2 giugno 2024
- Attivazioni: 5
About testing Mode:
1.To get the best usage experience please use the tick data to test and adjust the test speed to proper speed (tick price jump quickly but K bars scroll slowly)!!!
2.Click "Indicator Properties"-> Click "Reset" before testing the indicator to restore the default parameters of the indicator.
1. Compound Drawings
- (1) Line segment with arrow
- (2) Continuous line segment (broken line)
- (3) Parallelogram
- (4) Polygon
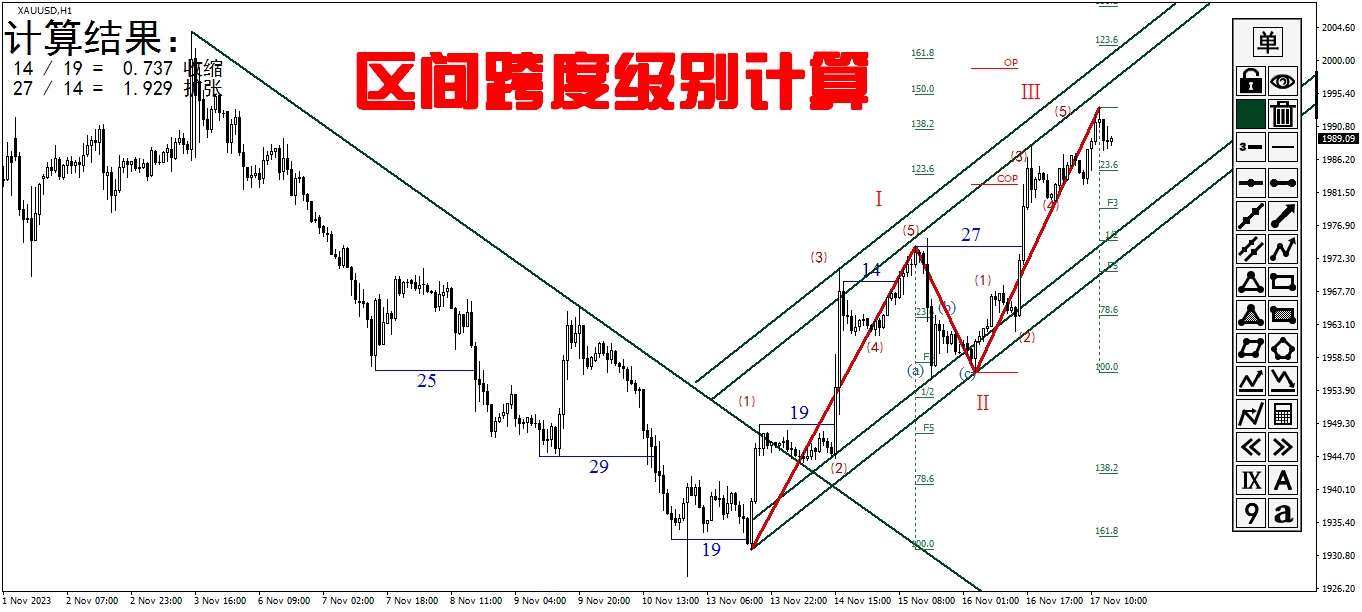
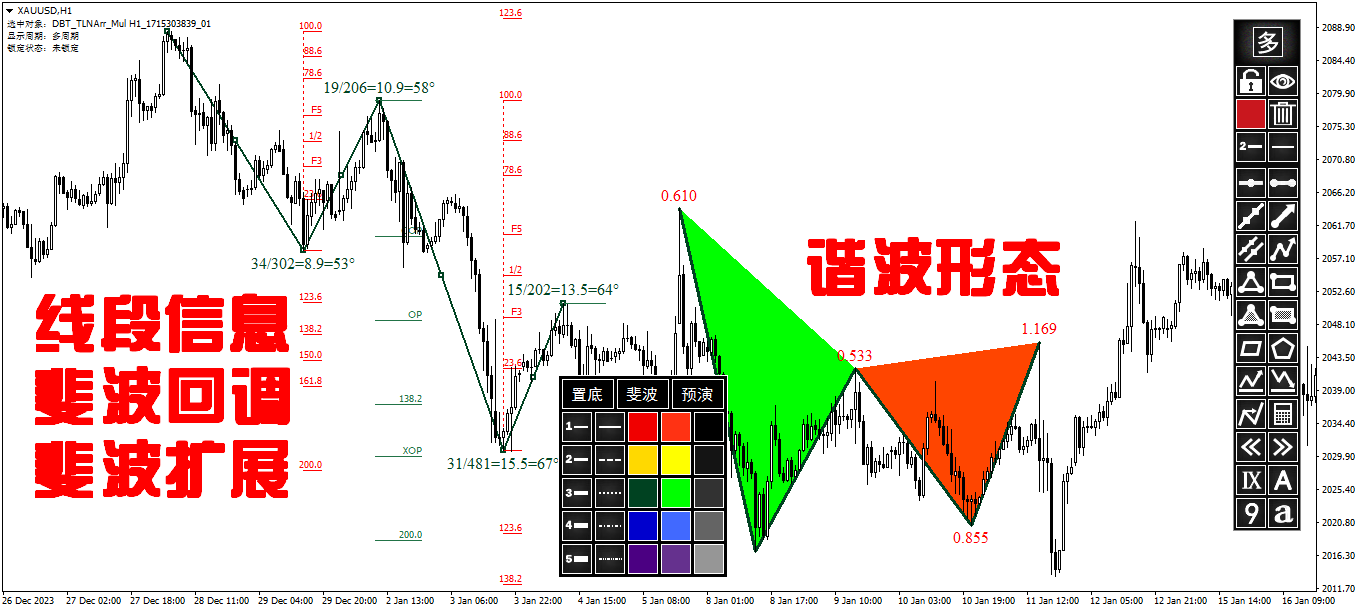
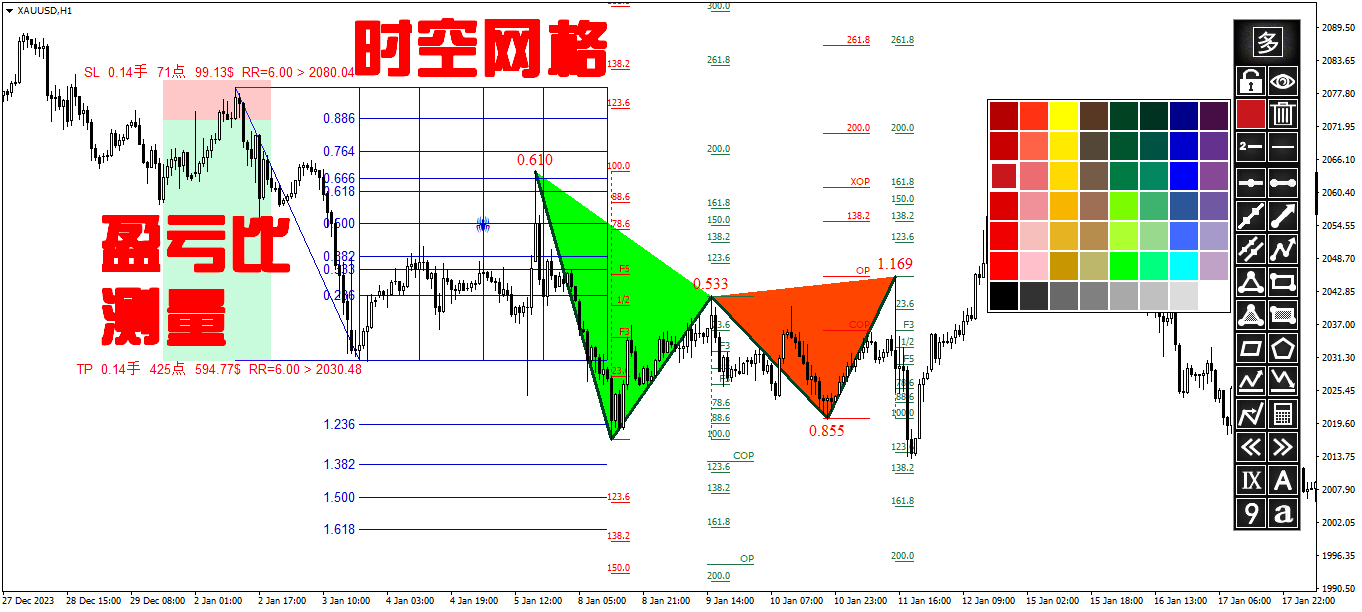
- (5) Profit and loss ratio measurement tools
2. Backtracking By the Z key in the process of drawing the line
Line types that support Z-key backtracking:
continuous line segments (broken line) ,channels,parallelograms,polygons, and fibo extensions.
3.Automatic Adsorption
- (1) Click the "Lock-Button" to switch the automatic adsorption switch before drawing the line
- (2) The shortcut Ctrl key can be used to switch the automatic adsorption during drawing
4. Stretch Horizontally To Right
When drawing a trend line segment or rectangle, click the "Line-Type-Button" or the shortcut key C to switch horizontal extension.
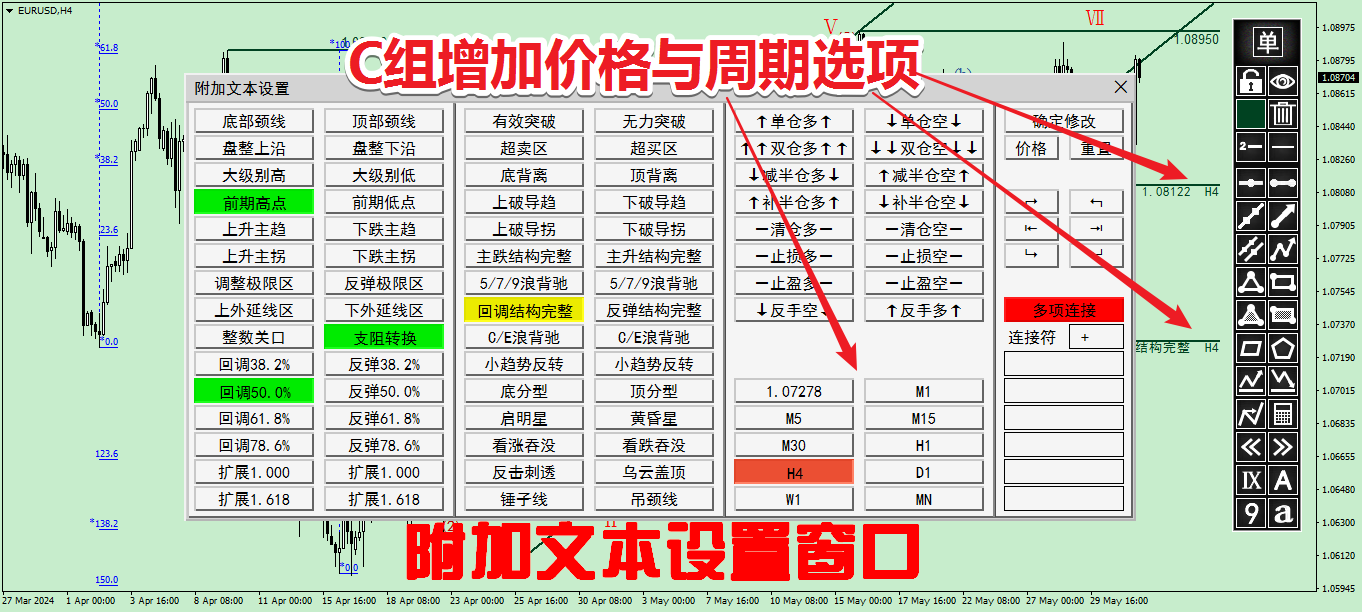
5. Show On TF Of Drawings
Click the "多/单" button and the "Line-Style-Button" to set the single tf/All tf/specified tf display.
6.Stop Drawing
- (1) Click the original location twice
- (2) Click the button on panel
- (3) Click on the price axis on the right
- (4) Special treatment of continuous line segments
- Click in the original location -- without arrow
- Click on the right price axis -- with the arrow
- Click the button to stop -- with arrow
7. Object Selection
Click an object to select it. The information about the selected object is displayed in the upper left corner of the chart and the audio of the object is played. Whether the object is locked or not has different sound effects.
8. Lock/Unlock Selected Object
Select the object and then click the "Lock/Unlock-Button".
9. Object Replication
Select objects (trendline and rectangle) and click the "多/单" button to copy, or the shortcut key V to copy.
10. Delete Selected Object
Select the object and then click the "Delete-Button" to delete.
11. Delete In Batches
Click the "Delete-Button" when no object is selected to bring up the Batch Delete panel.
12. Continuous Lock
Click the "Lock/Unlock-Button" to enable continuous lock mode when no object is selected.
13. Continuous Deletion
Shortcut key D To enable or disable continuous deletion. Click "连续删除" to disable continuous deletion.
14. Hide Drawings
Click the "Visibility-Button" to show and hide all drawn lines.
15. Hide the Candlestick
Shortcut key K hides the candlestick.
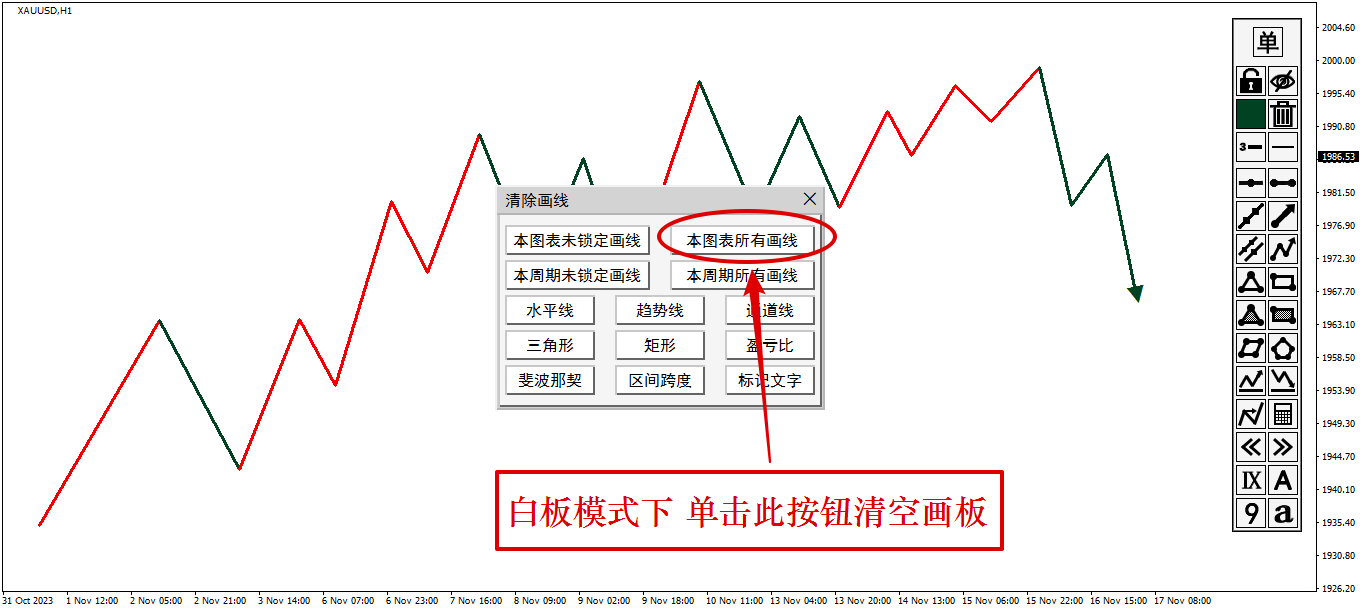
16. Whiteboard Mode
Hide all drawn lines + hide candlestick .
Delete whiteboard contents: If no objects are selected, click Delete to display the Batch Delete panel. Then click All in This Chart to clear the whiteboard
17, Adjust Trend Line To Keep Horizontal/Fibo To Keep Vertical
Select the object (trendline and Fibo callback FIbo extension) and use the shortcut key C.
18. The Trend Line Flips Horizontally
- (1) Shortcut key H-- left and right symmetric horizontal flip
- (2) Shortcut key 2--2:3 more steep horizontal flip
- (3) Shortcut key 3--3:2 more gentle horizontal flip
19, Two-Color Switch
- (1) Shortcut key G - red and green switch
- (2) Shortcut key R - red and blue switch
20.Object Properties Panel
- (1) Double click the object
- (2) Shortcut key E
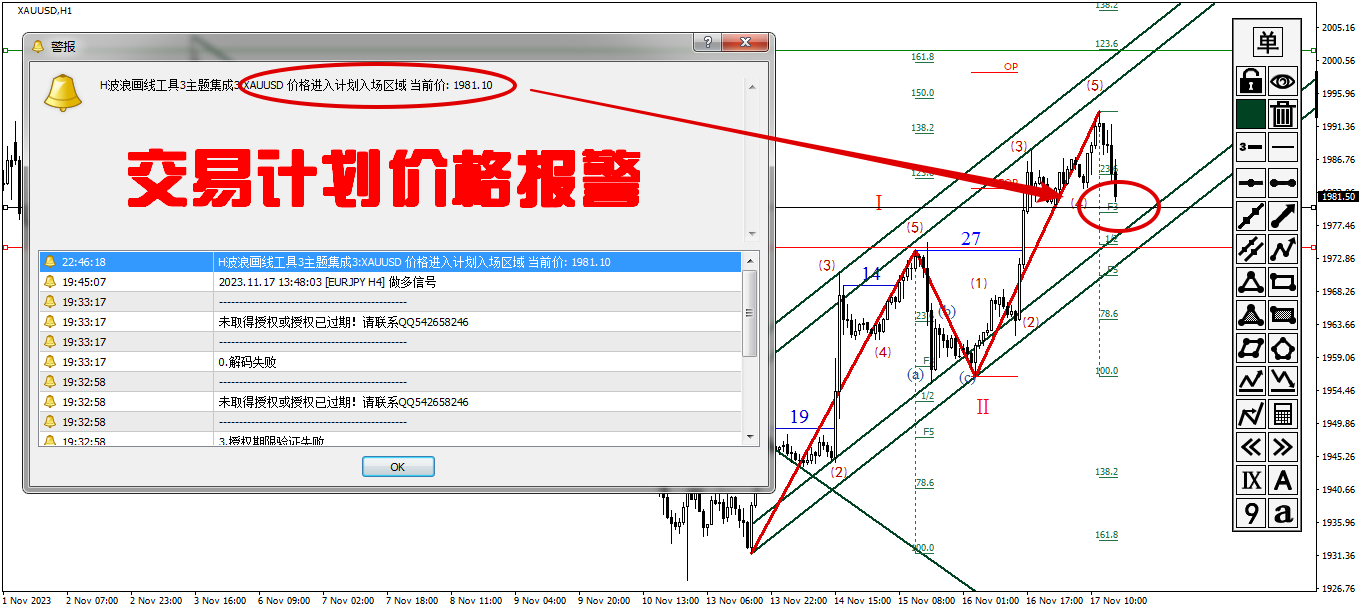
21.Drawings Alert
Double click the objects to bring up the properties panel and click the alarm switch button to turn on and off the alarm
22. Save Screenshots
- (1) Shortcut key J-- bring up the screenshot settings panel
- (2) Shortcut key O-- save the screenshot