Auto Format
- Utilità
- Gennadiy Stanilevych
- Versione: 6.96
- Aggiornato: 28 novembre 2021
- Attivazioni: 13
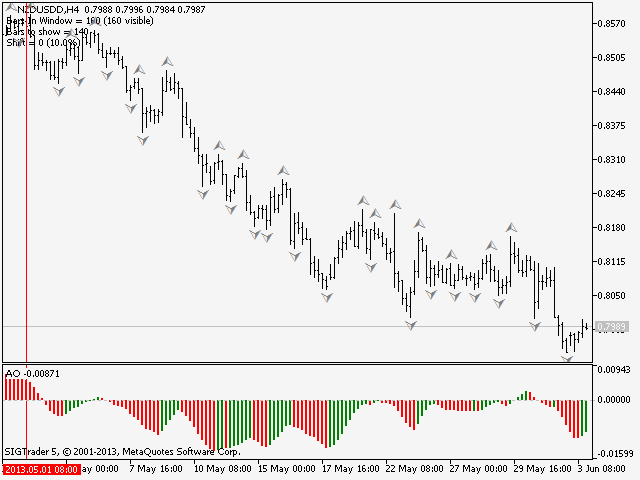
This is an utility for automatic scaling of a chart and making at least 140 bars visible in it. This is necessary for a correct wave analysis according to the Bill Williams' strategy "Trading Chaos". The utility can be used on any timeframe available in МetaТrader 5.
It draws a vertical line through the first bar the calculation starts from. This line allows you to see the probable starting point of the wave sequence along with a sufficient number of bars displayed in the chart. It also makes the wave labeling easier for the price history of an instrument displayed on the selected timeframe.
The indicator can automatically choose a required lower timeframe considering 140-150 bars that should be displayed. To do it, select the required area on the chart using a rectangle and then double click with the mouse on a line of the rectangle. The indicator will automatically choose a required timeframe for the wave analysis. To return to the initial timeframe, click the corresponding button in the MetaTrader 5 interface, and to delete objects use "Delete".
It is recommended to save the indicator in a template together with the other standard Bill Williams' indicators included in the MetaTrader 5 package or with their analogs available in the MQL5 Market. Namely the following:


















Привет коллеги! Скажу одно, что этой утилиты мне оооочень не хватало, когда я начал изучать Билла Вильямса, я вручную переводил с помощью скрипта МТ4 нестандартные таймфреймы, чтобы увидеть волны Эллиота, на это уходило куча времени и сил. Теперь изящно с помощью двух кликов мышки можно углубляться и углубляться вплоть до 1минуты, пока вы не увидите четко структуру волны, а это, в свою очередь дает вам видение, где вы, в какой волне находитесь и что вам делать дальше - сидеть и ждать или выходить из позиции. Геннадий в этом деле - эксперт трейдер, все продумал, молодец, что скажешь. Покупаю пока только его продукты, лучше не нашел.