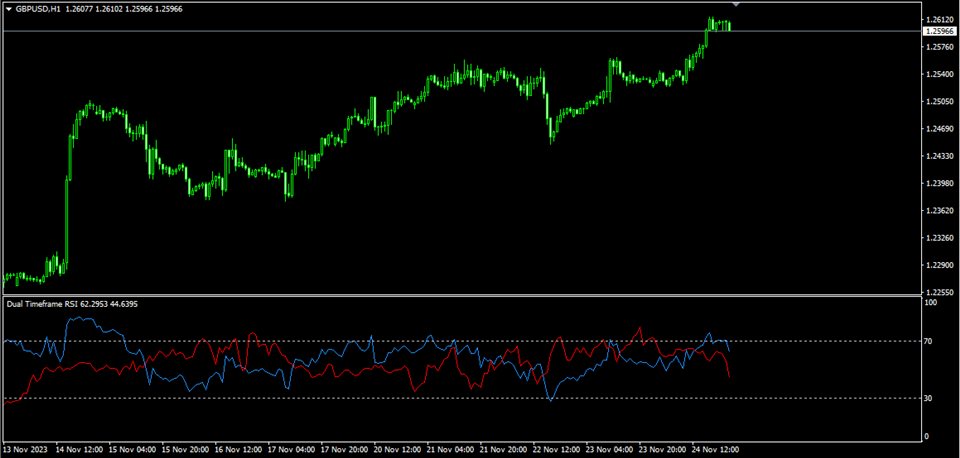
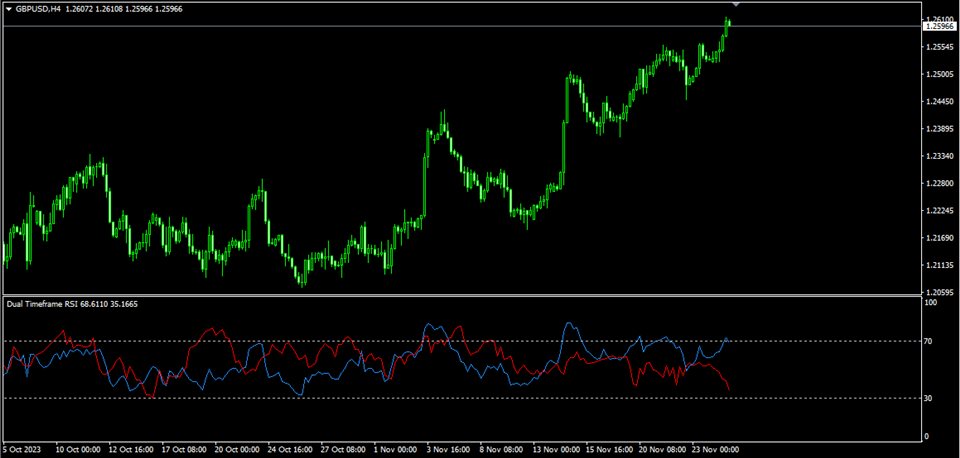
Dual Timeframe RSI
- Indicatori
- Davit Beridze
- Versione: 1.0
Check my paid tools they work great and I share Ea's based on them for free
please rate
The Dual Timeframe RSI (Relative Strength Index) indicator is a novel trading tool that allows traders to monitor RSI readings from two different timeframes on a single chart. This dual perspective enables traders to identify potential trend confirmations and divergences more effectively. For instance, a trader might use a 1-hour RSI alongside a daily RSI to ensure that short-term trades align with the broader market trend.
Variations in its usage could include:
- Trend Confirmation: Traders can confirm the strength of a trend by looking for agreement between short-term and long-term RSI readings.
- Divergence Trading: Spotting divergences between RSI readings on different timeframes can be a sign of potential trend reversals.
- Overbought/Oversold Conditions: The indicator can help identify overbought or oversold conditions on multiple timeframes, adding depth to the analysis.
By using RSI values from two timeframes, traders can make more informed decisions that consider both immediate price action and longer-term trends.
Input Parameters for Dual Timeframe RSI:
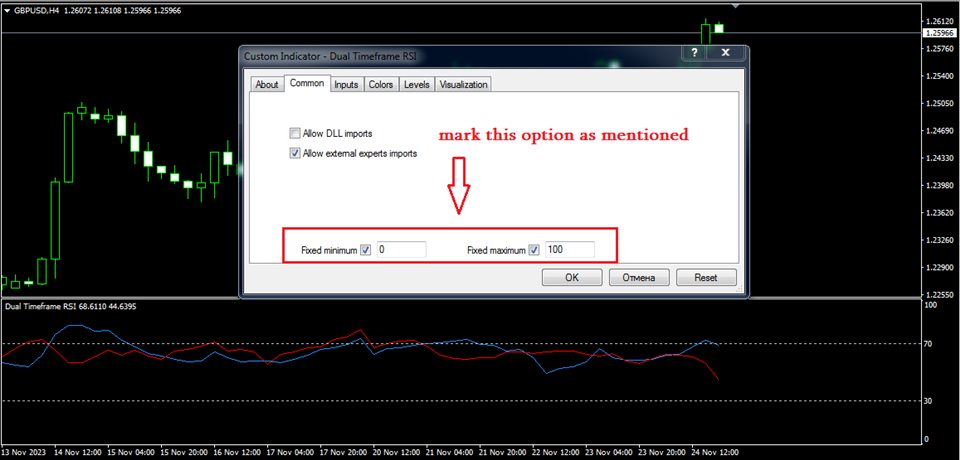
- RSI_Period_Main : This sets the period for the RSI calculation of the current timeframe.
- RSI_Period_Secondary : This sets the period for the RSI calculation of the secondary (chosen) timeframe.
- TimeFrame : This parameter allows the user to select the timeframe for the secondary RSI line.


