Black horse indicator MT5
- Indicatori
- Shengzu Zhong
- Versione: 1.22
- Aggiornato: 2 giugno 2024
- Attivazioni: 10
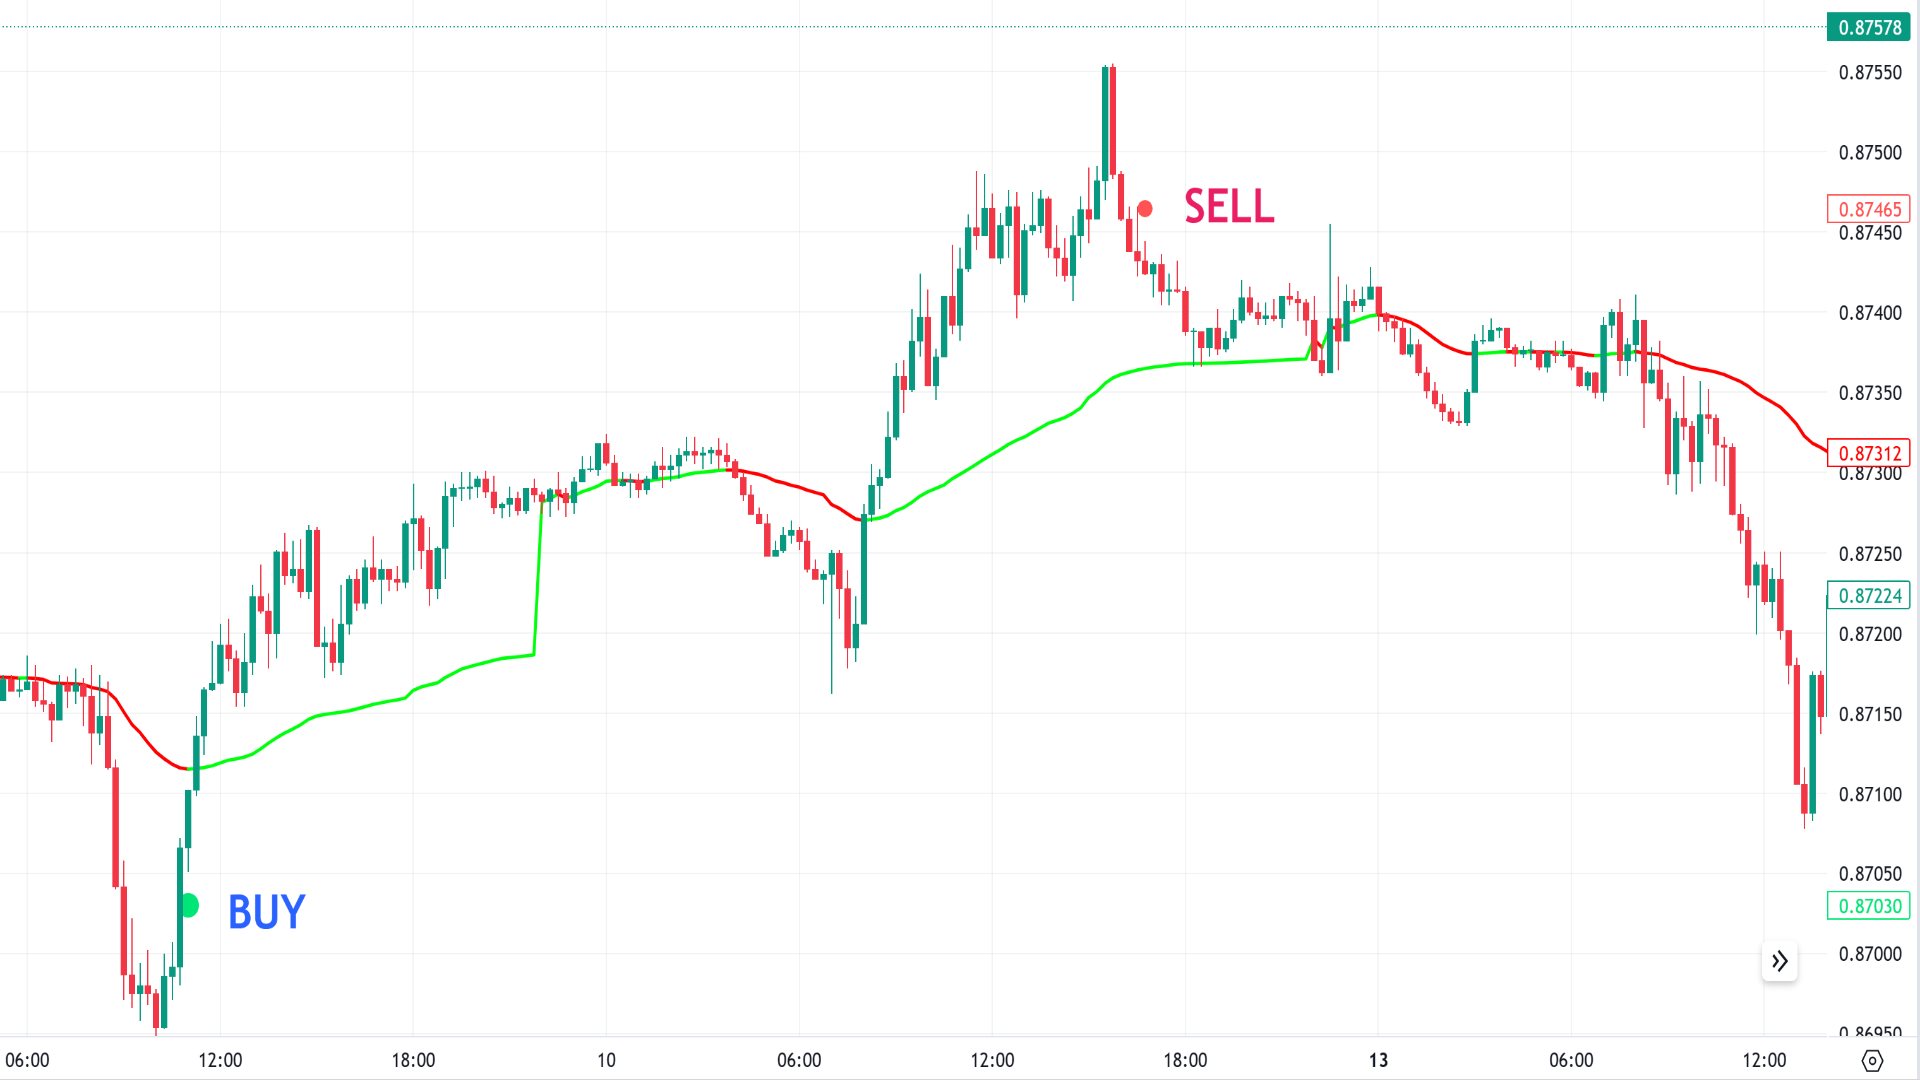
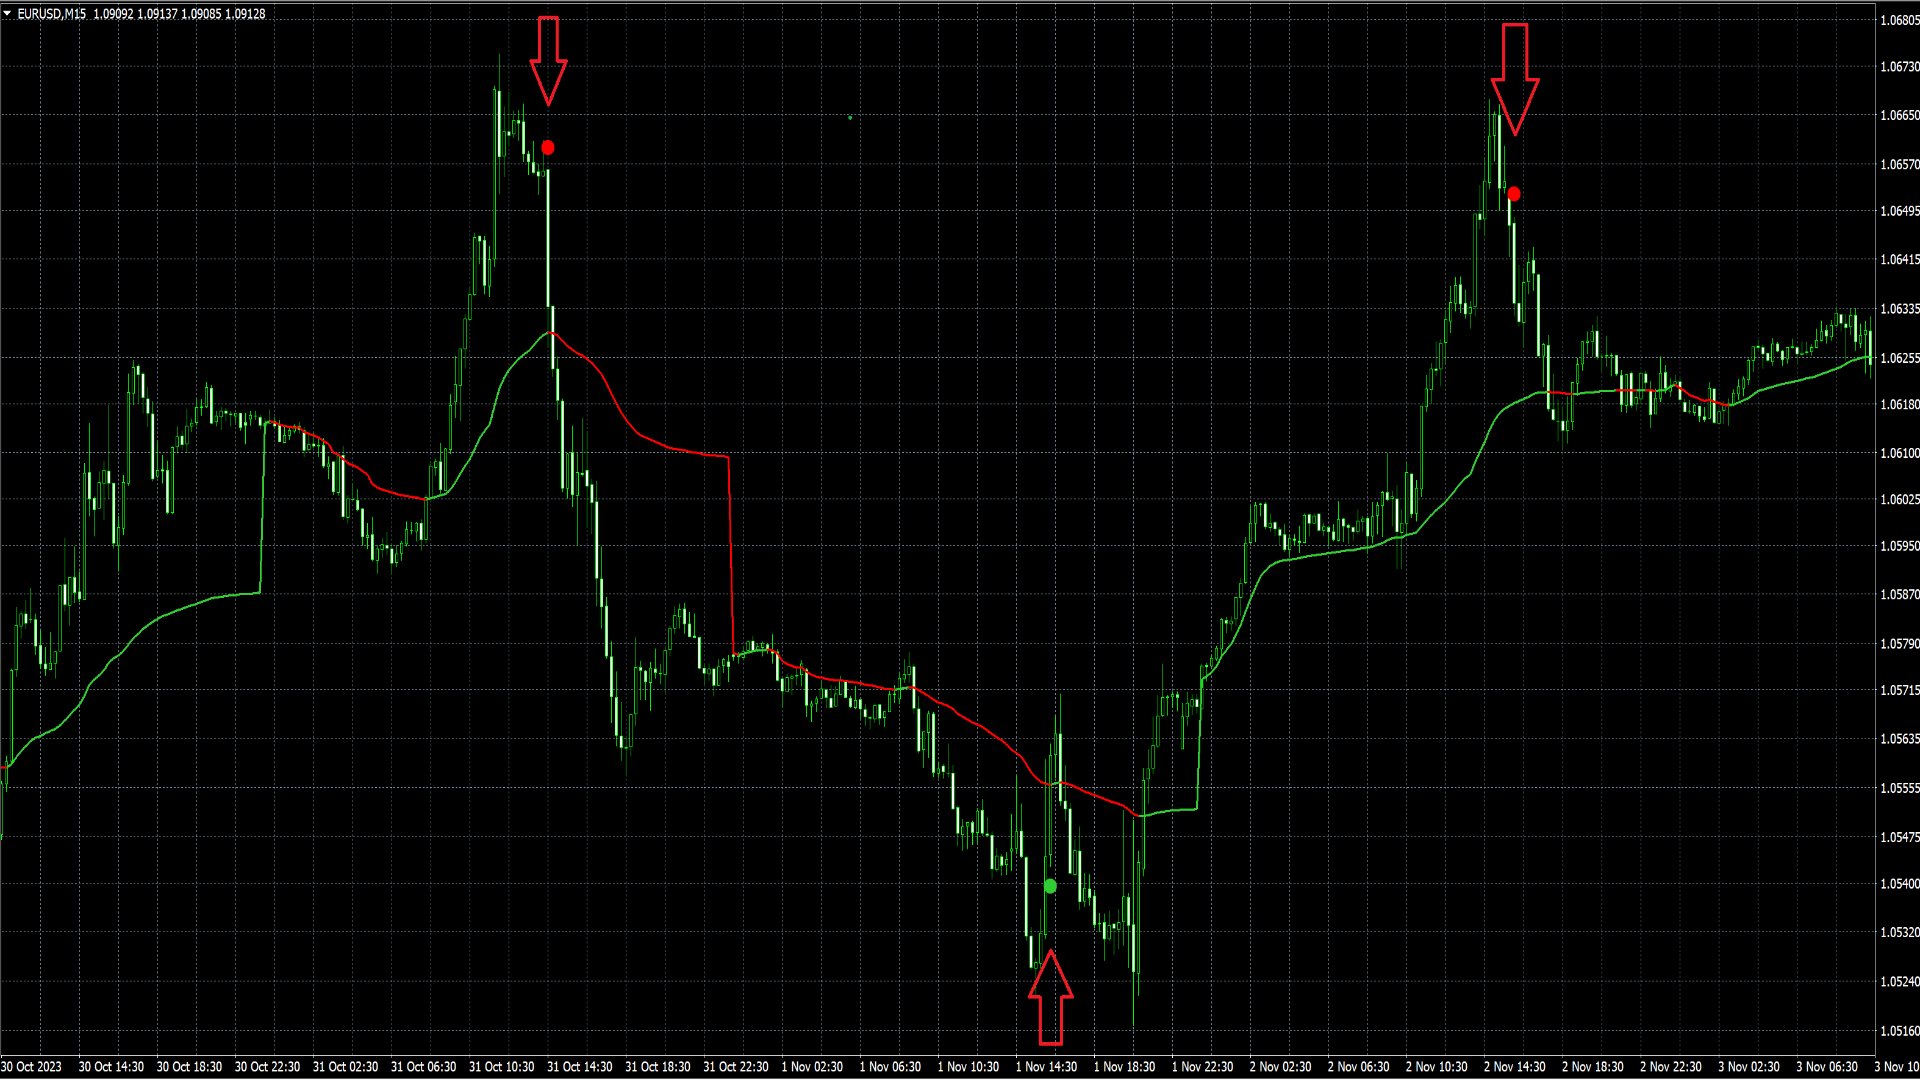
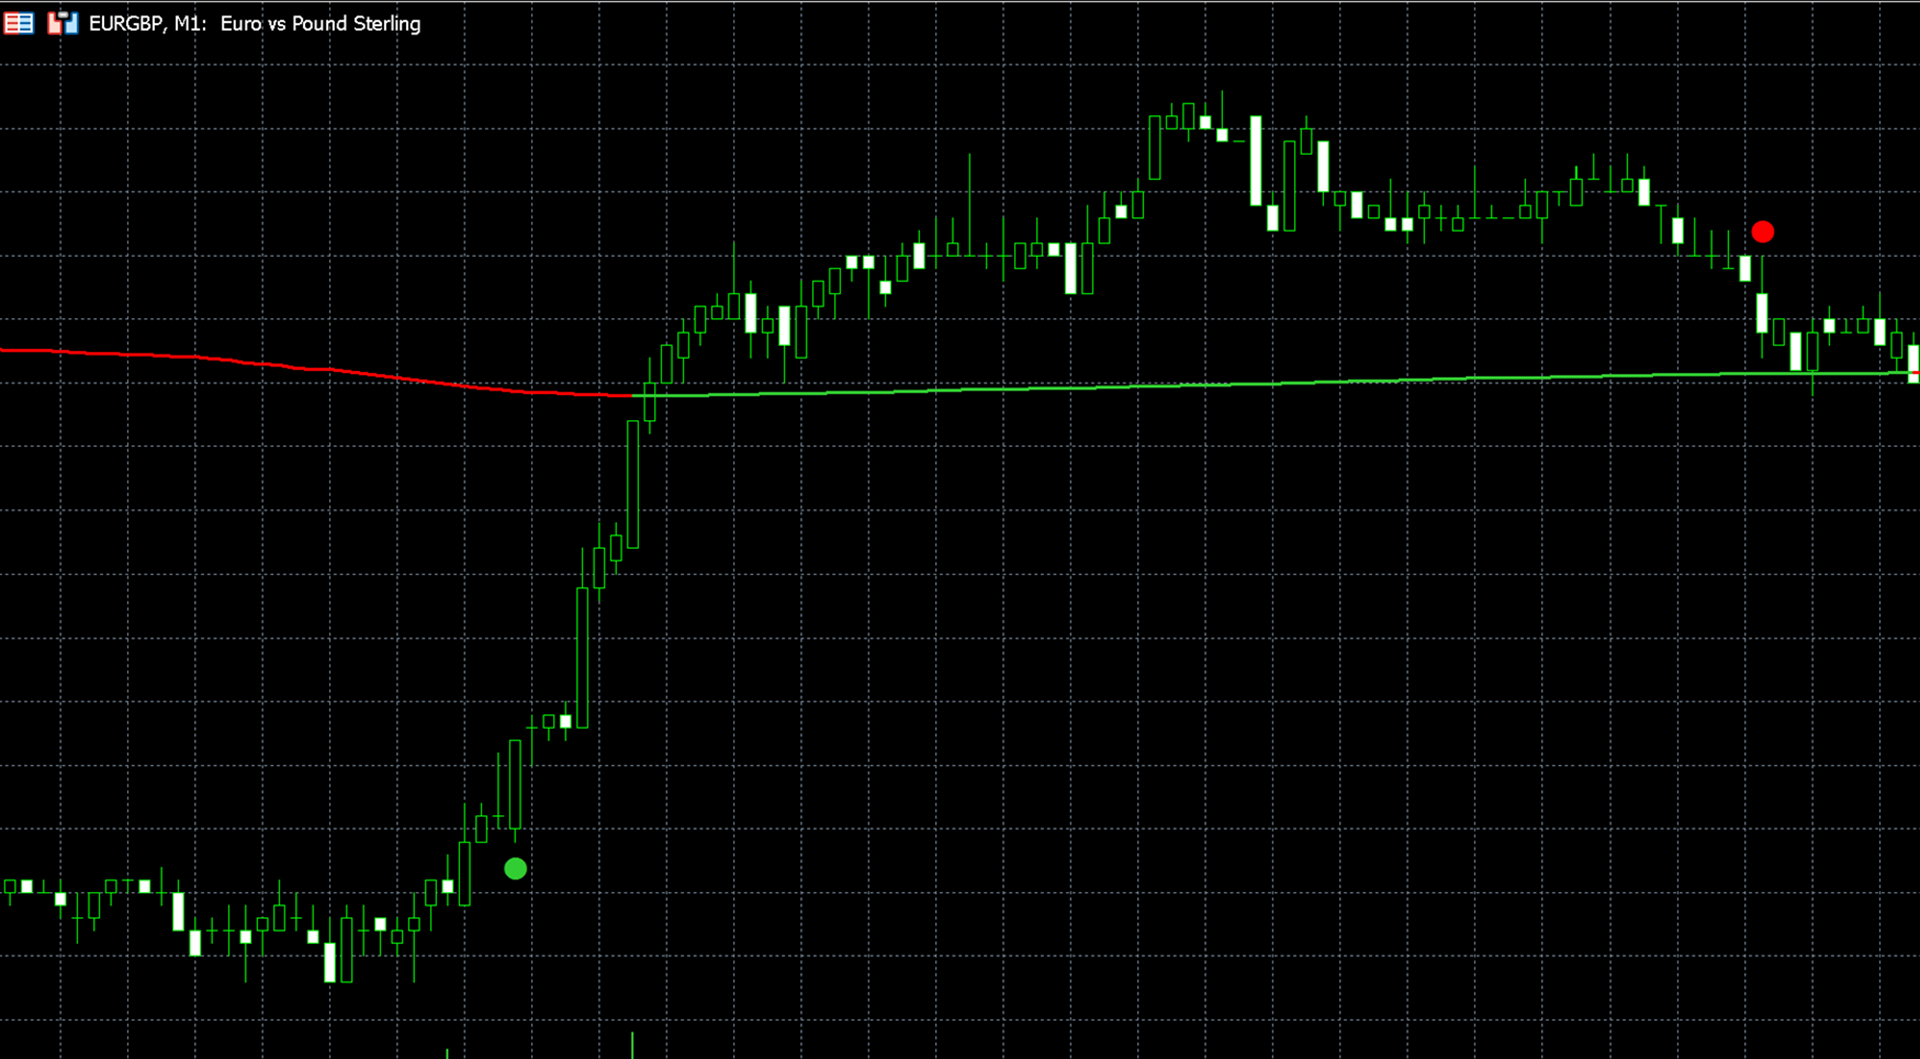
L'obiettivo dell'indicatore "Black Horse" è identificare le divergenze tra l'andamento dei prezzi e l'indicatore VWAP. Utilizza filtri per eliminare potenziali divergenze false e segnalare avvisi di alta qualità e precisi.
Le divergenze ribassiste sono indicate da punti rossi sopra la candela, mentre le divergenze rialziste sono rappresentate da punti verdi sotto la candela.
Il principale filtro per le divergenze si basa sull'ATR (Average True Range) e sul movimento dei prezzi nelle candele precedenti all'interno del periodo di riferimento. Le divergenze vengono identificate quando il movimento dei prezzi nel periodo di riferimento mostra una nitidezza sufficiente, superando il moltiplicatore ATR moltiplicato per l'ATR.
A causa delle caratteristiche del calcolo, è consigliabile impostare valori più bassi per il moltiplicatore ATR e il periodo di riferimento quando si lavora con frame temporali più alti. Nei frame temporali più alti, dove i movimenti dei prezzi tendono ad essere più levigati, come ad esempio nel grafico a 15 minuti, le variazioni dei prezzi accentuate si verificano meno frequentemente e sono generalmente contenute in meno candele rispetto ai frame temporali più bassi. Anche le azioni con una volatilità più bassa, come HSBC, dovrebbero utilizzare moltiplicatori ATR più bassi e periodi di riferimento più brevi.
Nella sezione "Impostazioni Visuali", hai la possibilità di modificare il colore della linea VWAP, visualizzare colori alternati per il VWAP, regolare la dimensione dei segnali di divergenza e mostrare o nascondere la linea VWAP.