Volume Profile Institutional Live
- Indicatori
- Agustinus Biotamalo Lumbantoruan
- Versione: 1.85
- Aggiornato: 22 agosto 2024
- Attivazioni: 5
Unlock the Power of Market Analysis with Precision
Are you ready to take your trading to the next level? The "Institutional Volume Profile" indicator is here to empower your trading decisions like never before.
Key Features:
-
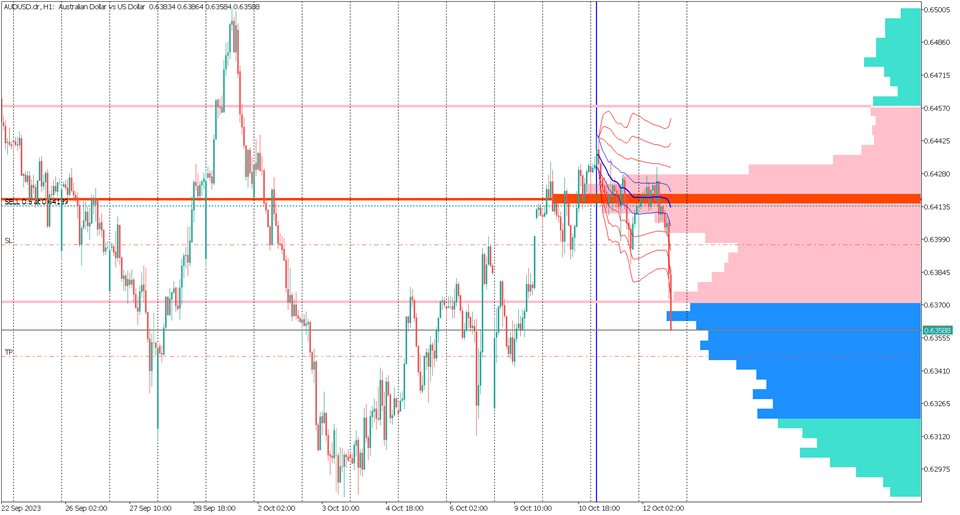
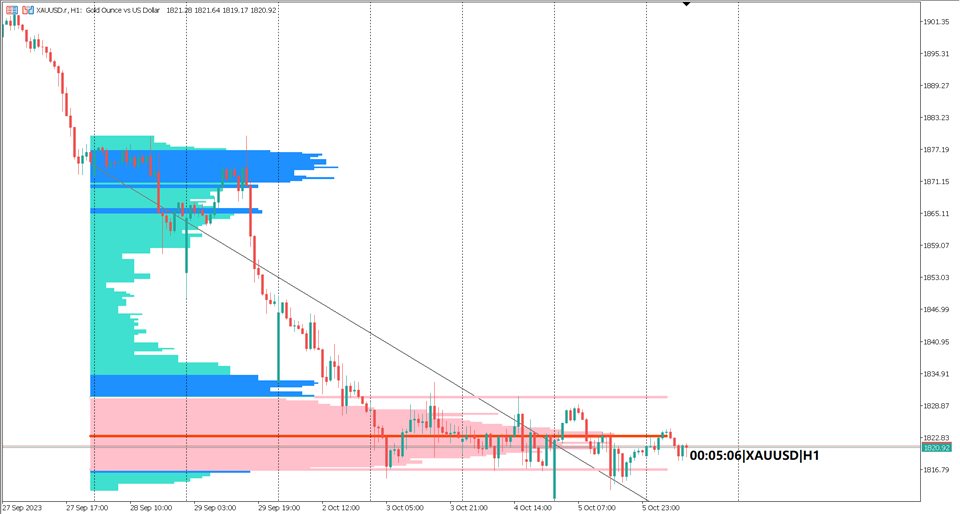
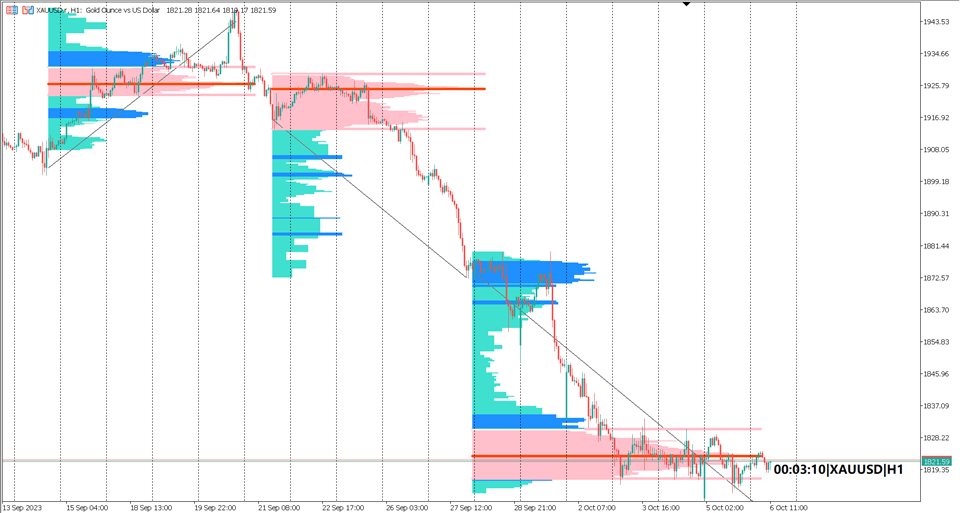
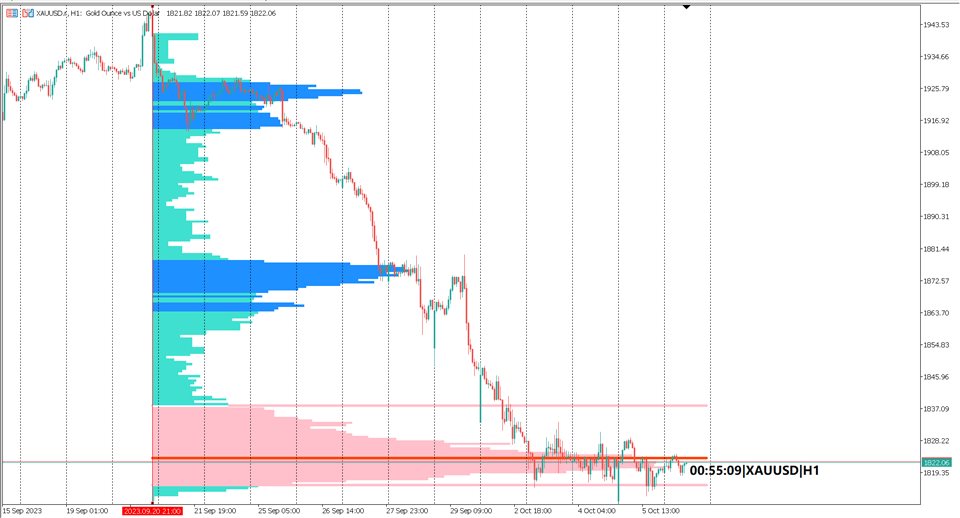
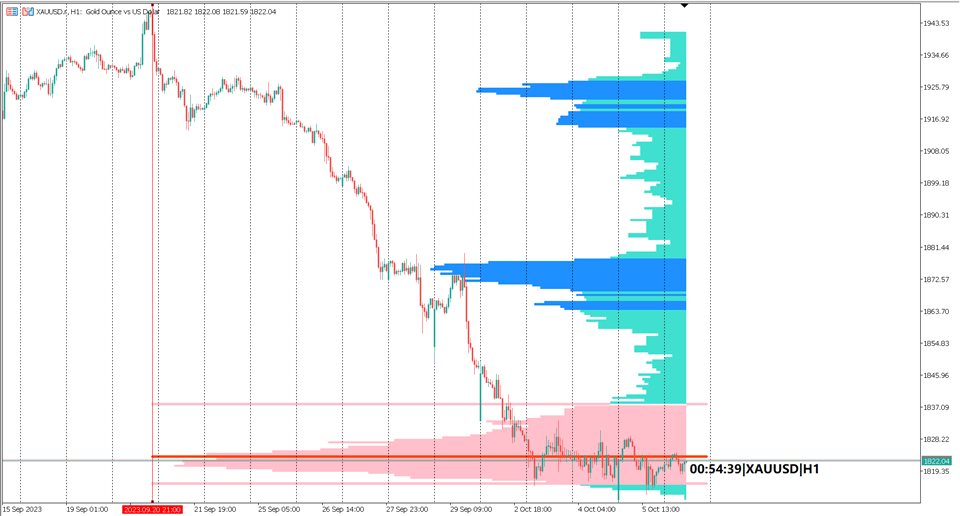
Custom Volume Profiles: Plot volume profiles effortlessly by simply adding horizontal lines or Fibonacci tools on your MetaTrader 5 chart. There's no limit to how many profiles you can create.
-
Insightful Visualization: The indicator beautifully displays crucial information right on your price chart, providing you with a deeper understanding of market dynamics.
Why "Institutional Volume Profile" Matters:
-
Pinpoint Market Balance: Discover the "Value Area," where market equilibrium is found. This area represents consolidation and offers opportunities for strategic entries and exits.
-
Identify the POC: The "Point of Control" (POC) indicates the price level with the highest traded volume. It serves as a pivotal reference point for traders, guiding decision-making.
-
Locate Low Volume Nodes: These are areas where market imbalances often occur, leading to potential trends. The "Institutional Volume Profile" helps you spot these turning points with ease.
-
Spot High Volume Nodes: "High Volume Nodes" signify strong areas of interest and significant trading activity. They can act as support or resistance levels, providing valuable insights.
-
Find Support & Resistance: The POC, value area & low value nodes can be use as a support & resistance level.
Trade with Confidence: The "Institutional Volume Profile" empowers you with data-driven insights, helping you make more informed trading decisions.
Versatile Tools: Whether you're a day trader, swing trader, or investor, this indicator is a valuable addition to your toolkit.
Intuitive Customization: Tailor the indicator to your trading style effortlessly with easy-to-follow input parameters. Just plug in the indicator to the chart, plot the horizontal line and bada bim bada boom, a volume profile appears within that horizontal line's date range.
Elevate your trading to a professional level with the "Institutional Volume Profile" indicator. Gain a deeper understanding of market dynamics, locate high-probability trade setups, and trade with confidence.
Take control of your trading journey today!
If you'd like to stop plotting volume profile on the trendline, please follow this instruction below:
If you have issue loading the profile, try reduce the number of candles drawn on the chart.



When you change time frames, the profile you have disappears and you have to redraw it on new time frame. That is not good and quite a pain in the ass. Unless I am missing something, but if not that is a big negative when you switch between time frames which we all do as traders.
is it the volume profile plotted by the graph objects like a trendline
or
the fixed volume profile plotted on the right side of the chart?
.
Could you please record a video of the issue please?
.
.
If you have issue with the right side of the volume profile gone occasionally (for instance when scrolling the chart), on your keyboard use the arrow key (left or right) to redraw the profile.
.
I have uploaded the latest version 1.61
Please try it out if it improves.
.
If possible could you please give higher ratings.
.
Thanks!