• Panoramica
  • Recensioni
  • Commenti

Persistent Trend

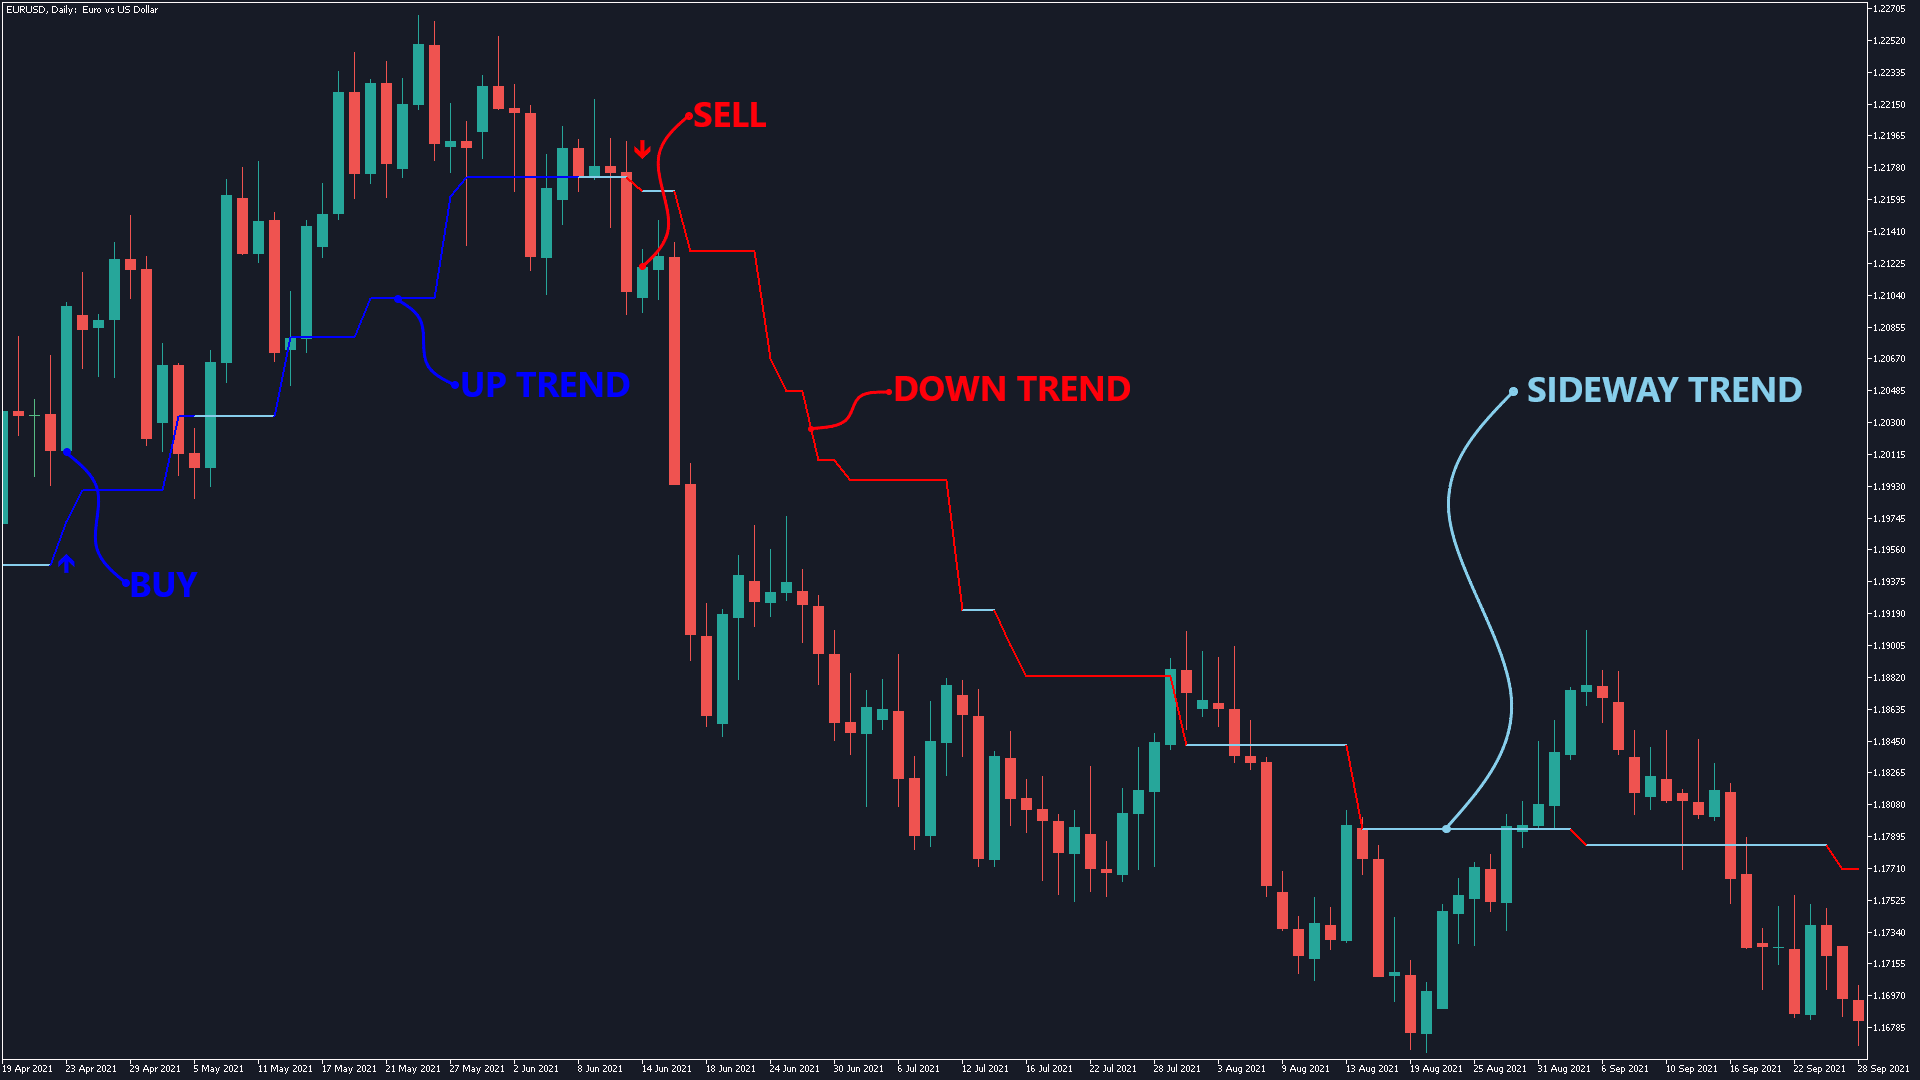
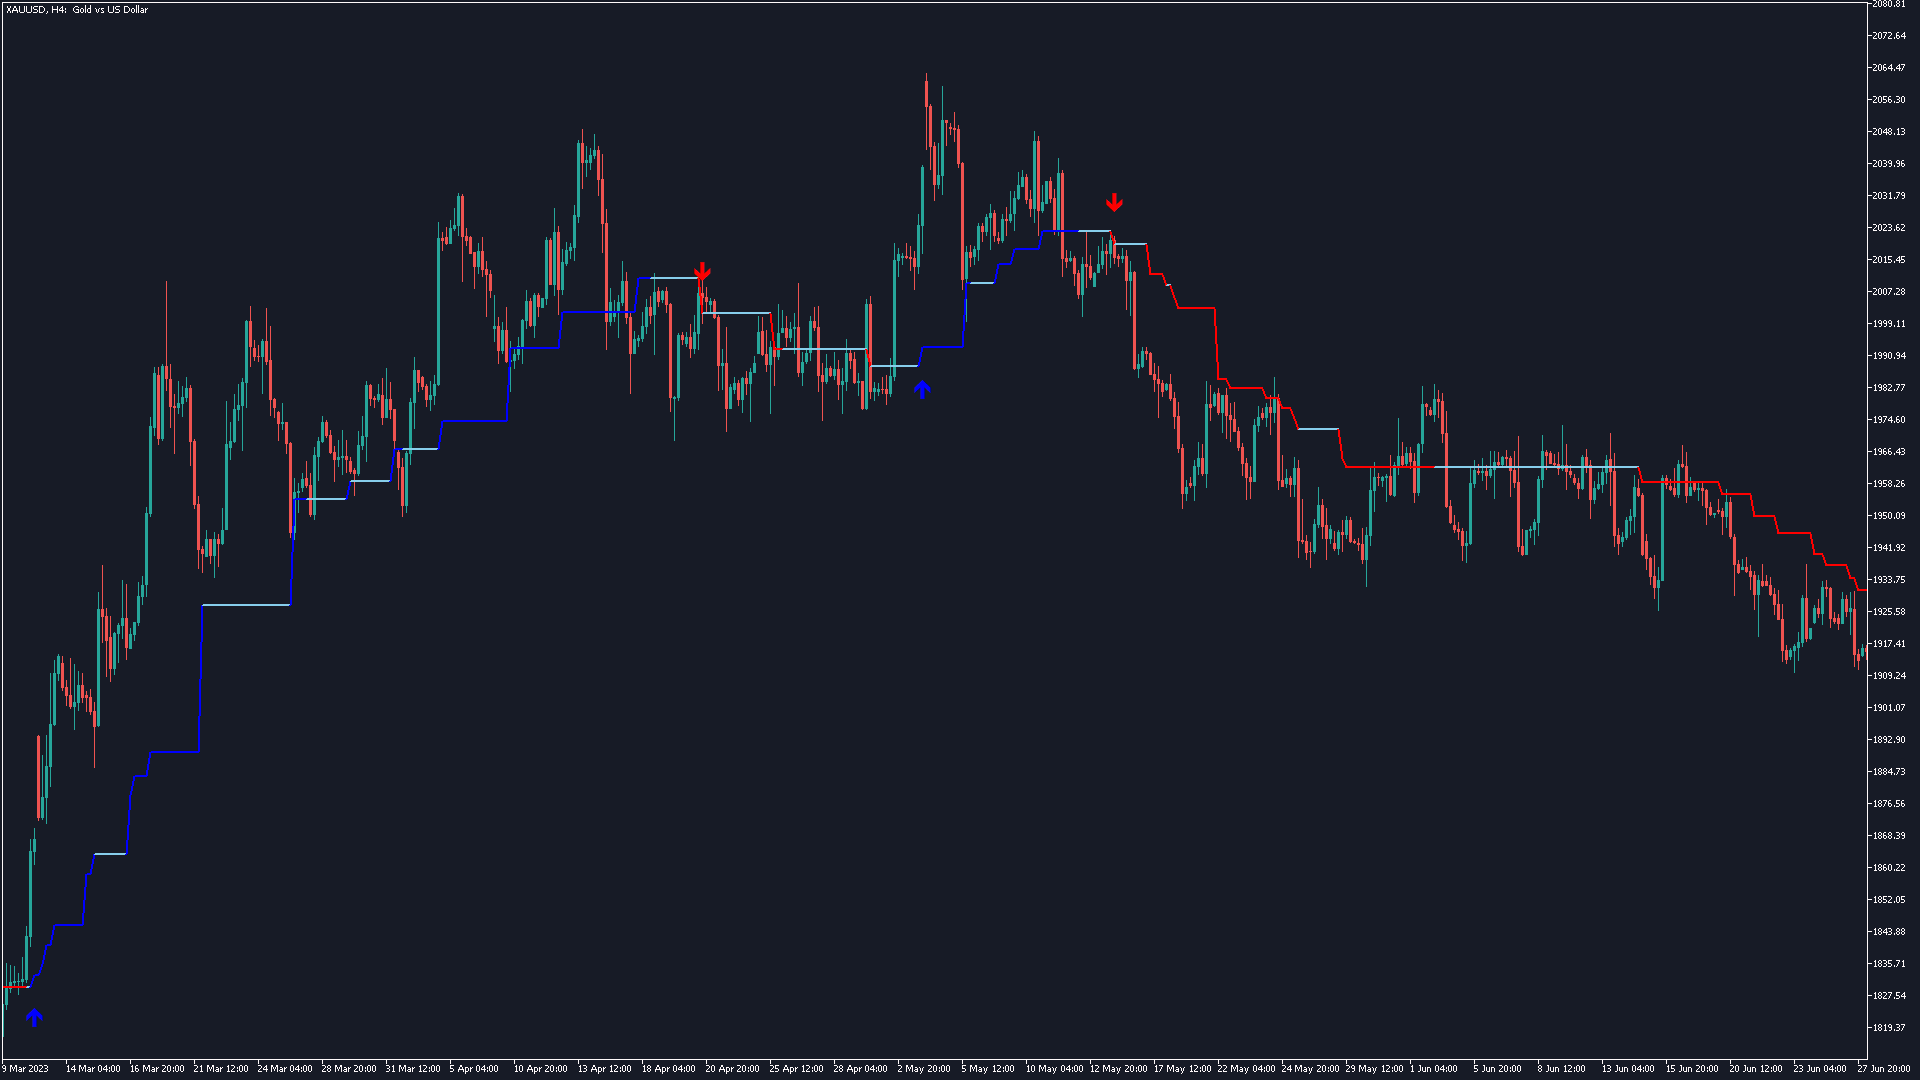
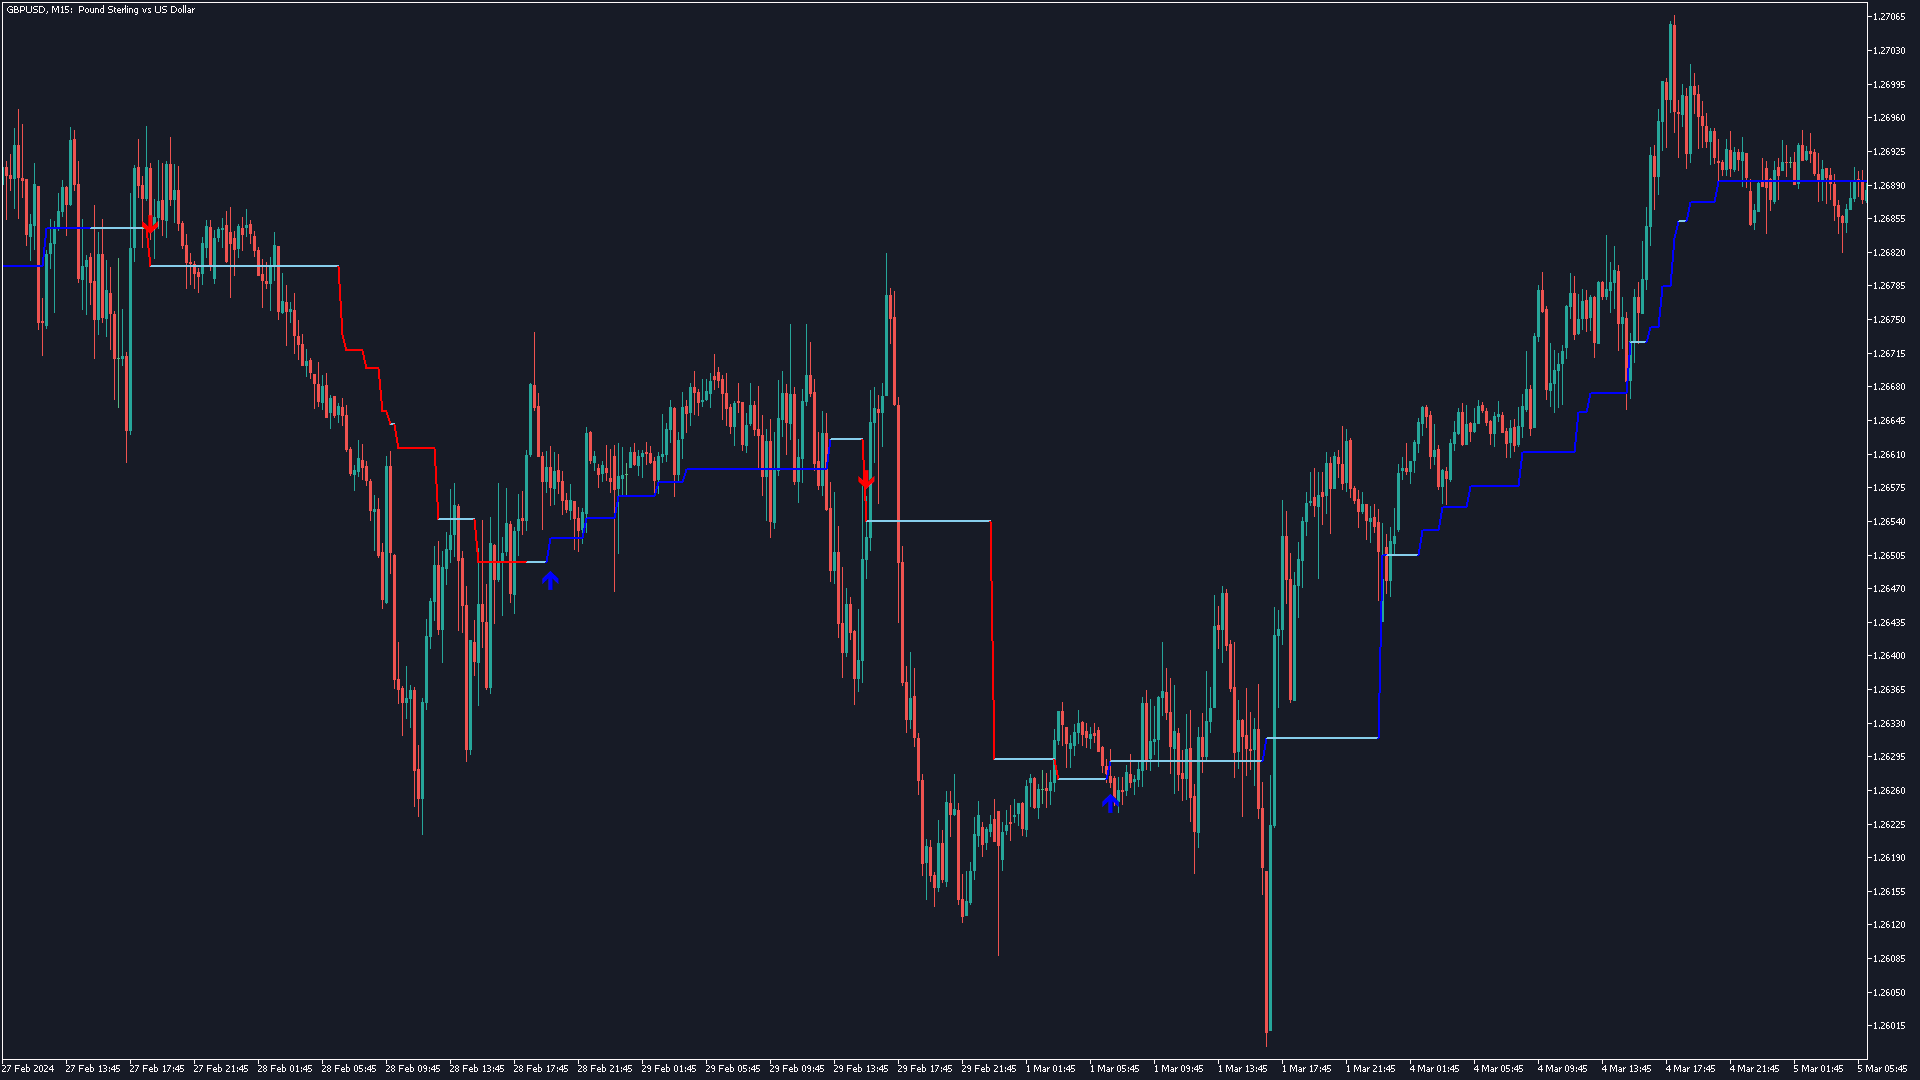
This indicator identifies the global trend and has a powerful algorithm for filtering out any type of noise that can interfere with trend direction identification. A special filter shows areas of sideways trend, consolidation or flat, which allows you to avoid any uncertainties in the market movement vision and gives a clear understanding of the global trend movement.

This indicator has no analogues and gives it unique advantages in the analysis of price movements and determination of the direction of the global trend, even in the presence of false rollbacks and temporary consolidation or flat.

This indicator is a powerful tool for traders of all levels of experience.

Note: All values of the indicator are available through indicator buffers, which makes it as easy as possible to use it in any of your Expert Advisors.

Key features:

  • Based on fractals and hidden patterns: This allows the indicator to quickly react to price movements.
  • Powerful noise filtering algorithm: This makes the indicator unique and gives it advantages in analyzing price movements and determining the direction of the global trend, even during false pullbacks and temporary consolidation or flat.
  • Non-Repainting and Non-Lagging: This gives a huge advantage when working.
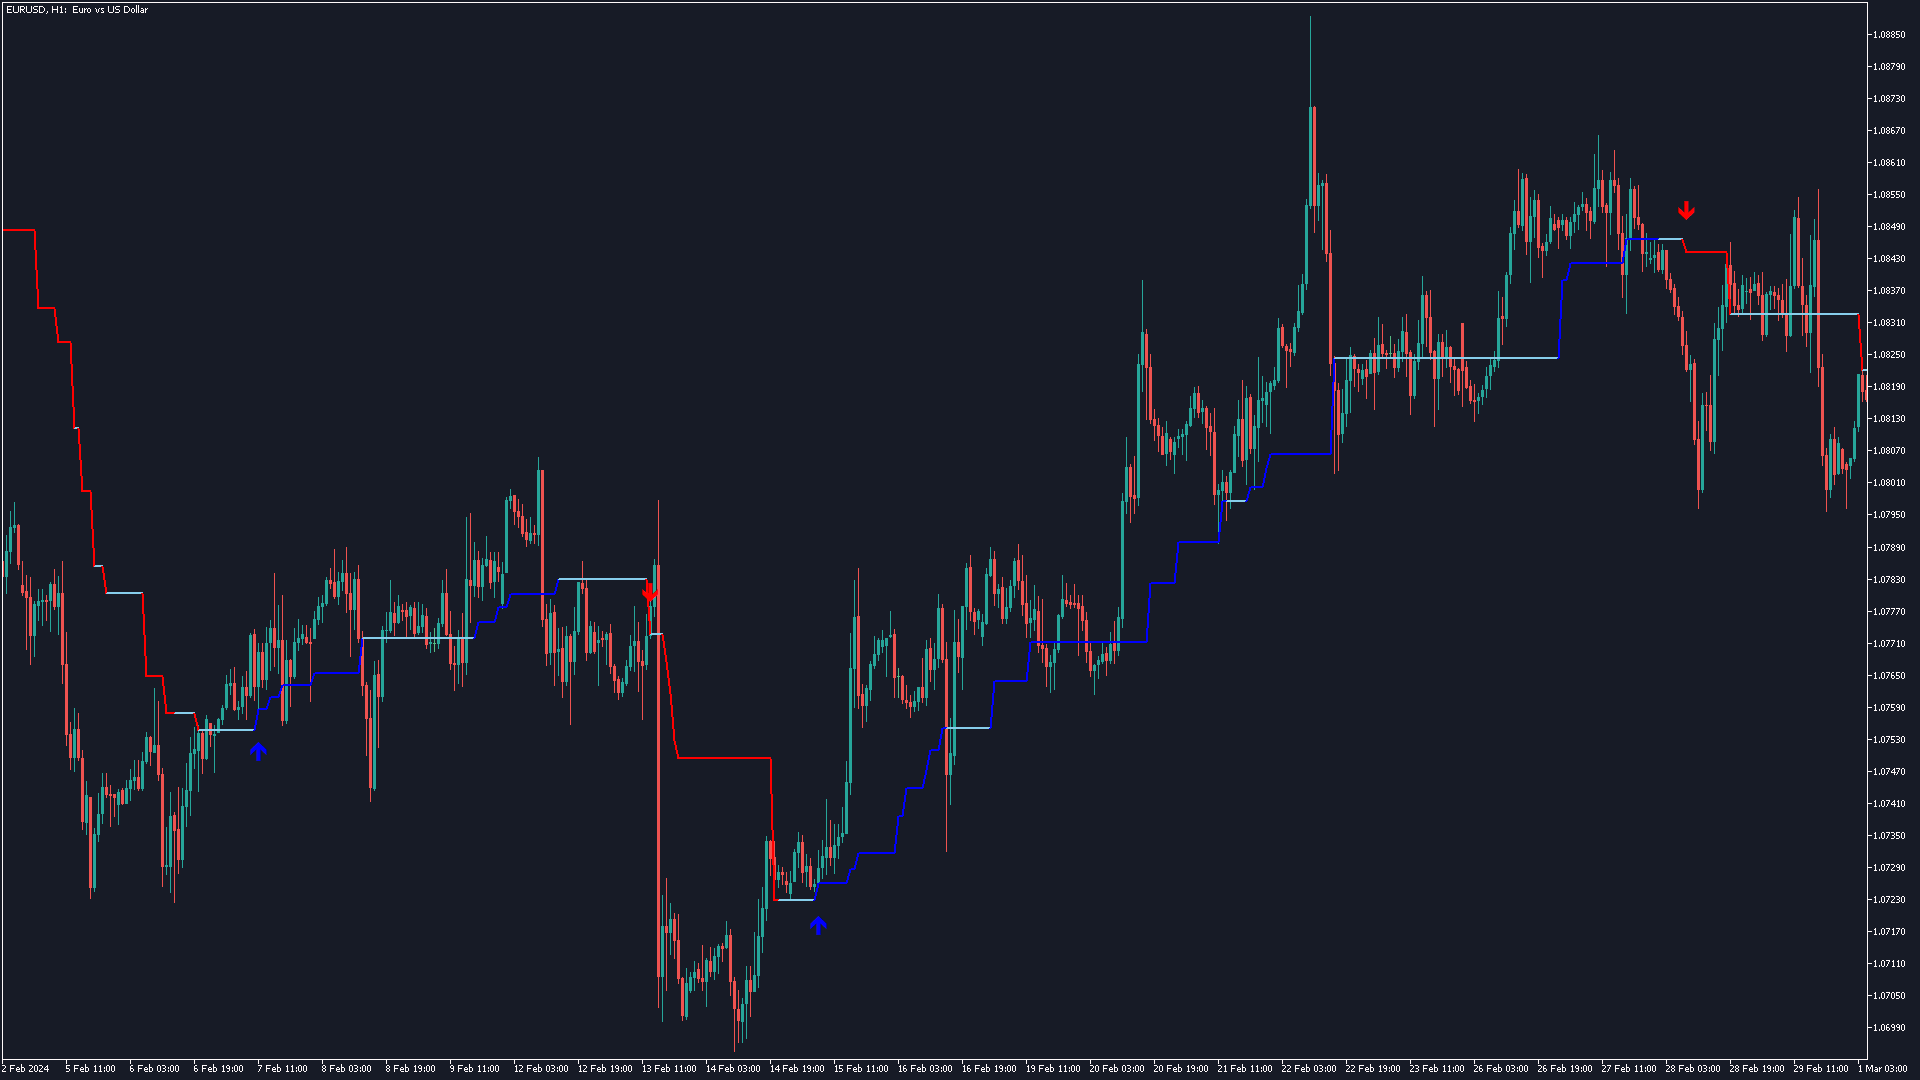
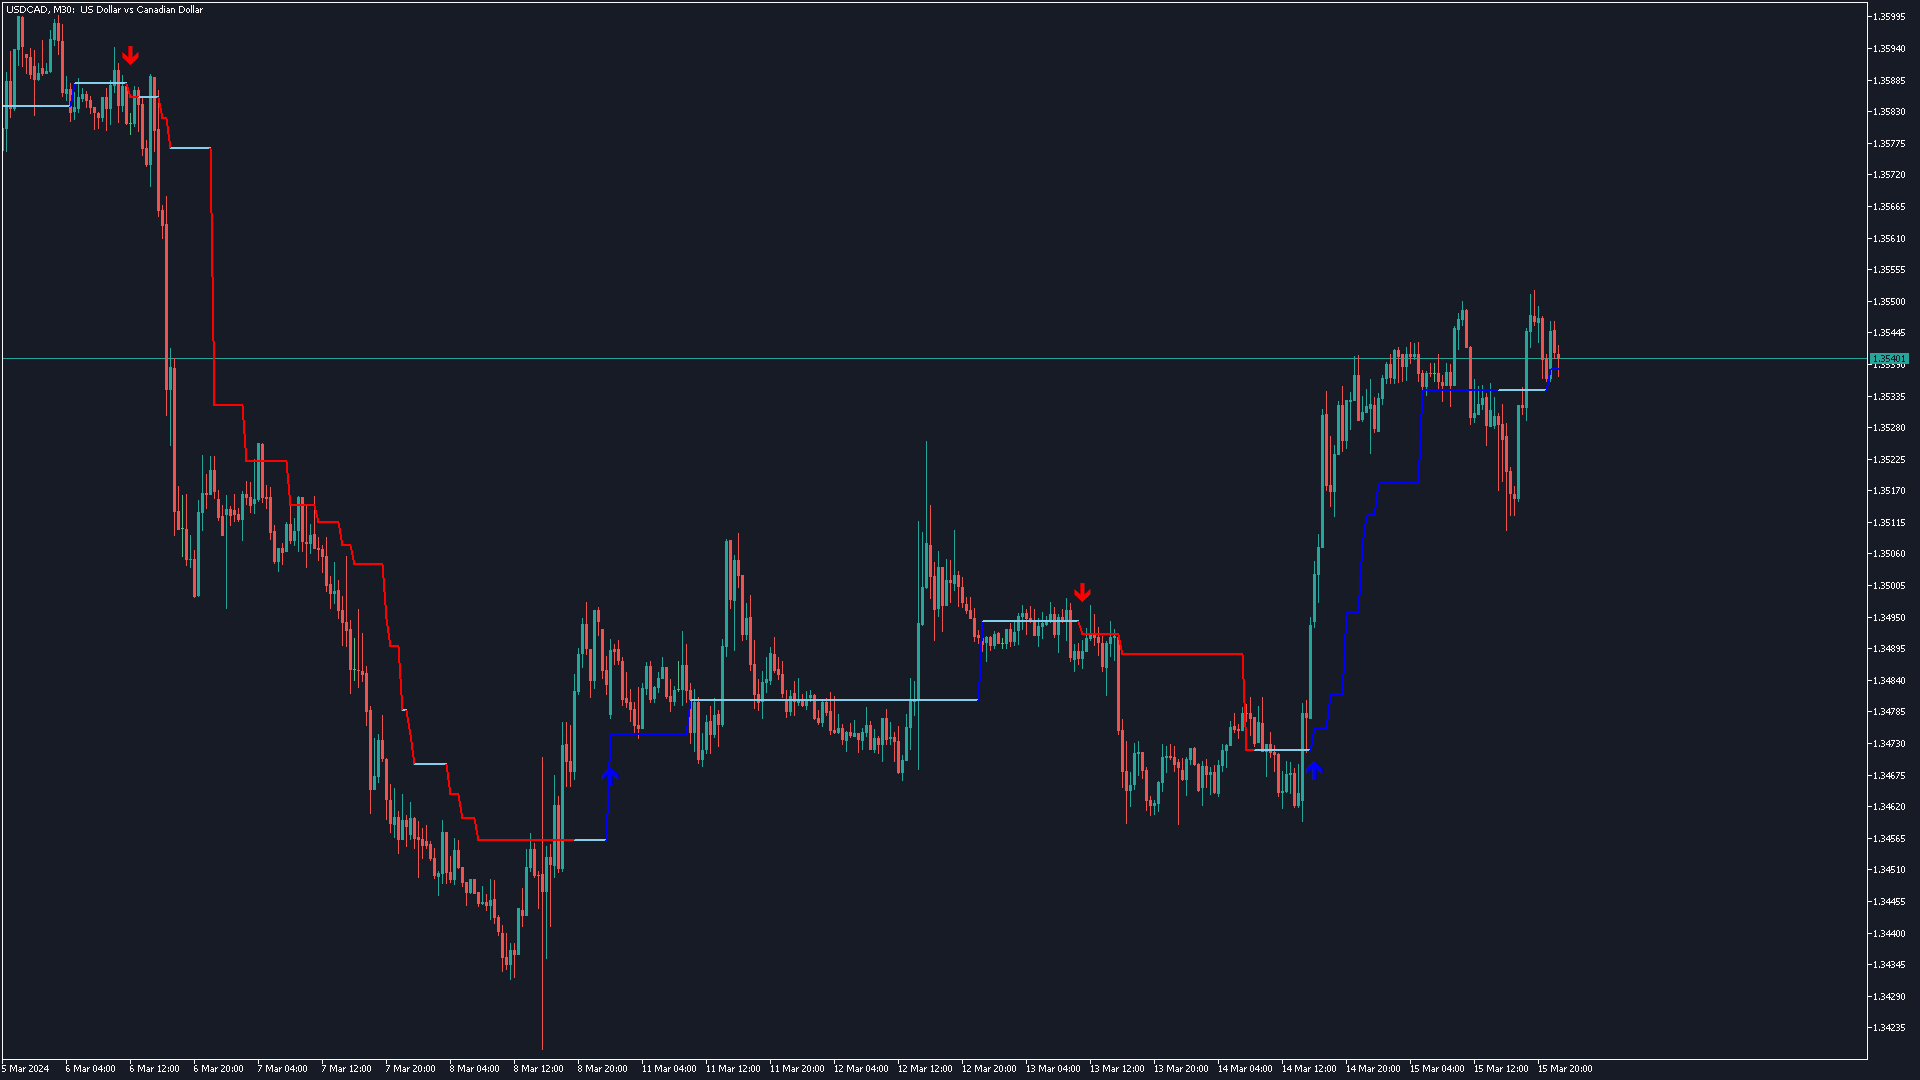
  • Signal arrows: Clearly shows the change in trend direction and the beginning of a sideways trend, consolidation or flat.
  • Alerts: Allows you to quickly and conveniently respond to signals.
  • Indicator buffers: All indicator values are available through indicator buffers, which makes it easy to use in any of your Expert Advisors.

Advantages:

  • Non-Repainting.
  • Non-Lagging.
  • Shows uptrend, downtrend, sideways trend, consolidation, flat.
  • Has a powerful noise filter that allows you to ignore sideways trend, consolidation and flat.
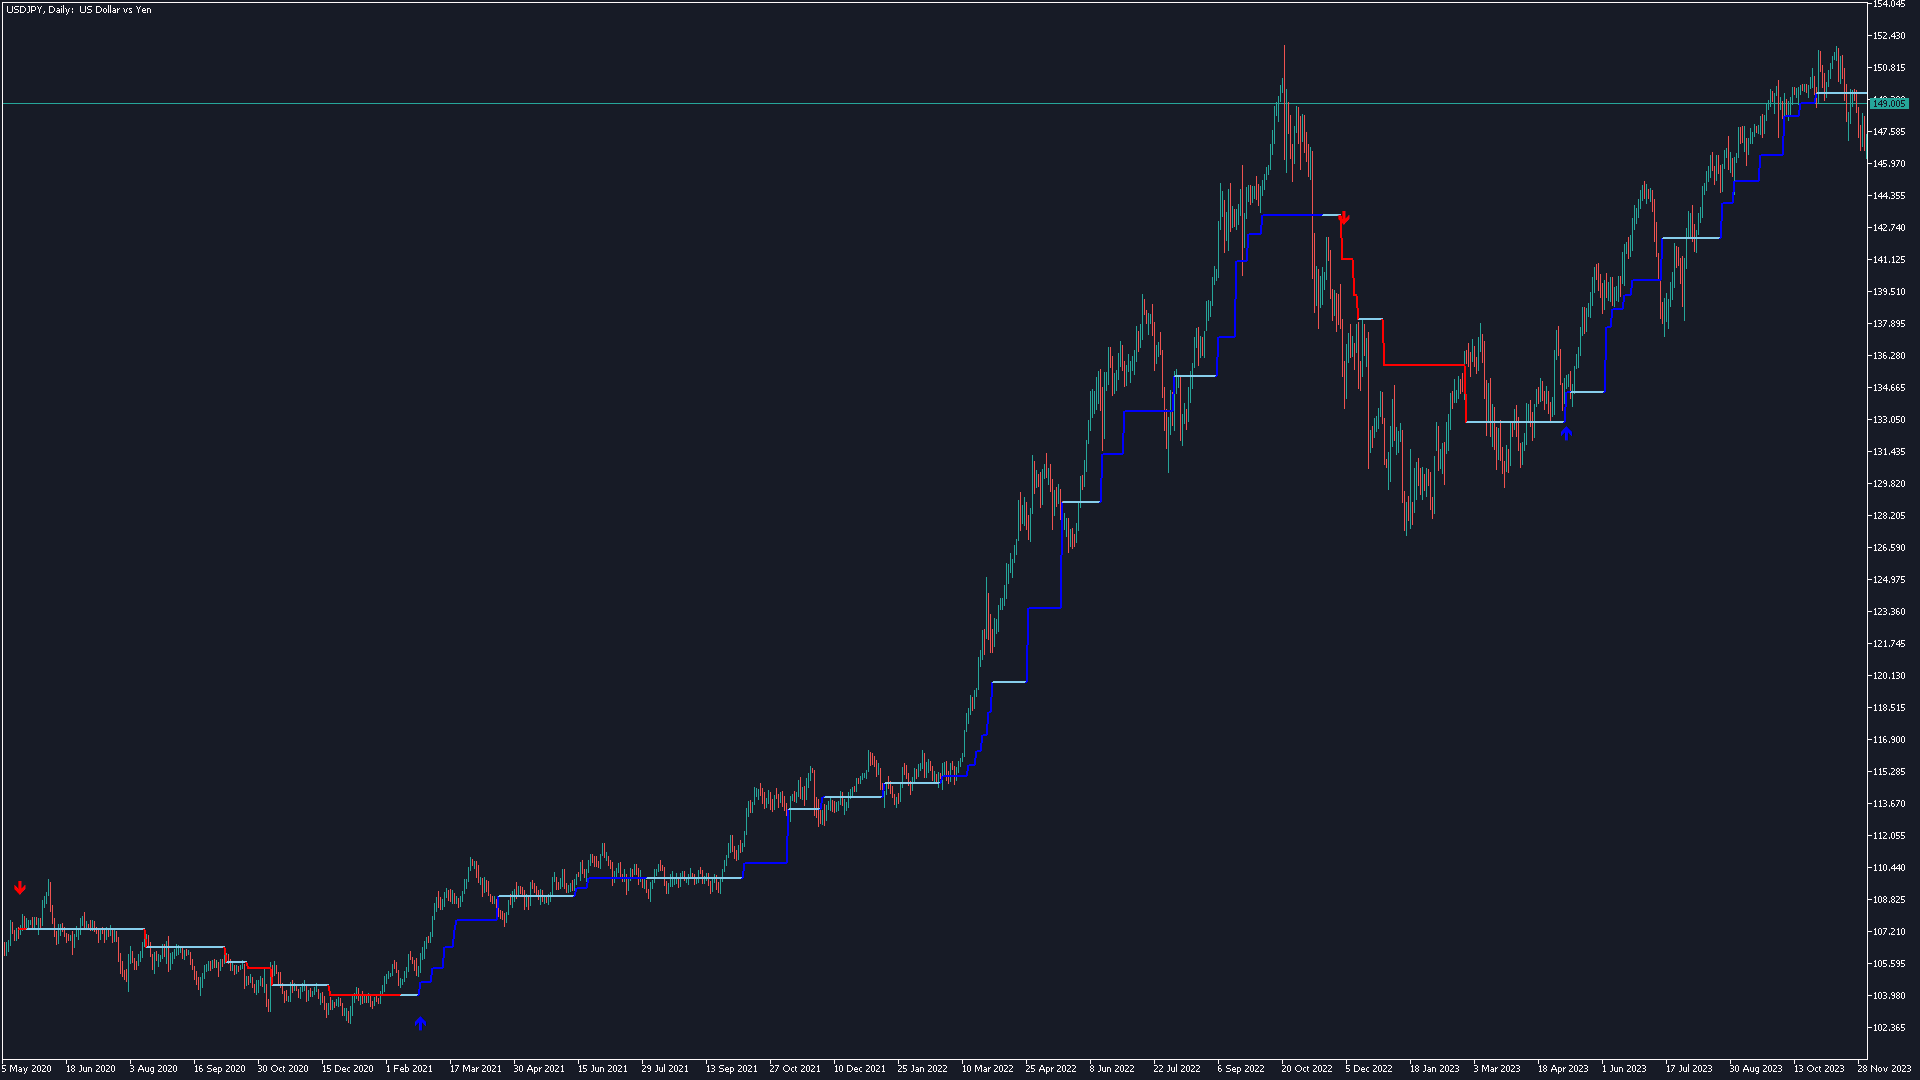
  • Draws signal arrows and trend line with different colors to easily identify the trend type.
  • Can notify, make a sound signal, send an email, send a Push notification to mobile devices.
  • Has all input parameters for fine-tuning the algorithm.

Recommendations:

  • Best Symbols: EURUSD, GBPUSD, USDJPY, XAUUSD
  • Best Time Frames: H1, H4, M15

Settings:

  • Fractal Size [1...10] - The size (in bars) of the fractal. For example, the size of the Bill Williams fractal is 2 bars. Required for the indicator base algorithm.
  • Deviation [1...100] - Indicates how far the fractals should be from each other. Required for the indicator base algorithm.
  • Trend Sensitivity Delay (0...20] - Delay in the rate of response to trend changes. The lower the value, the more sensitive the indicator reacts to market changes.
  • Bars Limit - Limit the number of bars in the history to calculate the indicator. This setting is useful for speeding up calculations.
  • Filter Power [0...100] - Noise filtering power. The higher the value, the deeper the filtering, but the more computing resources are required. Warning: At high values, the indicator may work much slower.


Prodotti consigliati
This is an original, agile, and excellent trending system. Whether you are a beginner trading novice or a professional trader, this set of indicators can help you quickly and timely track the latest changes in market trends. It has the following characteristics: The method of use is extremely simple, plug and play, and the display of all trend analysis results is clear at a glance; There is no need to configure any functional parameters, the trend tracking indicator will automatically analyze th
Trend Dynamics
Oleksandr Powchan
Trend Dynamics Expert Advisor is a level trader designed to be as precise as possible. Because of the extreme accuracy of the entries and the algorithms ability to filter out bad trades, the system does not take new trades every day. The system was not optimized and has fixed indicator settings as its universally adaptable. Be aware, that its recomended to run multiple pairs on the same account for more profit. Our Goal is to help you be way more profitable and way more stress free, so yo
The   Visual Volatility Clustering   indicator clusters the market based on volatility. The indicator does not redraw and gives accurate data, does not use closing prices. Uses the opening prices or the highs or lows of the previous completed bar. Therefore, all information will be clear and unambiguous. The essence of the indicator is to divide the price market into certain areas according to a similar type of volatility. This can be done in any way. In this example, the indicator is configure
Elliott Wave Trend was designed for the scientific wave counting. This tool focuses to get rid of the vagueness of the classic Elliott Wave Counting using the guideline from the template and pattern approach. In doing so, firstly Elliott Wave Trend offers the template for your wave counting. Secondly, it offers Wave Structural Score to assist to identify accurate wave formation. It offers both impulse wave Structural Score and corrective wave Structure Score. Structural Score is the rating to sh
Stenco Recover EA
Yevgeniy Koshtenko
Revolutionary Forex expert advisor, built on the principles of the unique Recovery trading system. The key to the effectiveness of this algorithm is the accurate analysis of price behavior near psychologically important round levels. Moreover, the system uses a special price representation in the form of coordinates different from traditional candlestick charts. Main advantages of the advisor: Recovery strategy, based on price recovery High accuracy in identifying key support and resistance leve
Trend and Signals MT5  indicator scans  30 trading Instruments (Forex, Metals and Indices).     It uses special algorithm on the  current market   based on   Pure Price Action   and display the overall trend and signal on the dashboard. When signals are produced the indicator sends alert and notification. Strategy for Signals This indicator uses the daily timeframe to determine the direction of the trend. The hourly timeframe is used to identify possible entries. Main trend and is determined by
Innanzitutto, vale la pena sottolineare che questo Strumento di Trading è un Indicatore Non-Ridipingente, Non-Ridisegnante e Non-Laggante, il che lo rende ideale per il trading professionale. Corso online, manuale utente e demo. L'Indicatore Smart Price Action Concepts è uno strumento molto potente sia per i nuovi che per i trader esperti. Racchiude più di 20 utili indicatori in uno solo, combinando idee di trading avanzate come l'Analisi del Trader del Circolo Interno e le Strategie di Trad
Analyze potential   Covered Call   structures in the Brazilian market. Define where you want the break-even of your structure and see what structure to use. It works for any asset that has authorized series of options on B3 (Brazilian Stock Exchange). Associate the indicator to the asset you want to set up the Covered Call. *** ATENTION *** For the robot to work, the service that consults the authorized series of B3 options must be running on your terminal. Download the utility for free from
FREE
Buffer Reader For MT5
Mounir Cheikh
3 (2)
The Buffer Reader will help you to check and export the custom indicators buffers data for your current chart and timeframe. You can select the number of buffer and historical bars to read/export. The data can be exported in a CSV format and the files will be stored in the folder:   \MQL5\Files . How it works Put the number of buffers to read in the Buffers_Total input parameter. Put the number of rows to display in the Rows_Total. Choose the CSV separator in the parameter. Copy the correct na
FREE
Ofir blue is the first full trading application for Telegram. It is proposed in 2 versions : OfirBlueLite (without trading) and OfirBluePro (with trading). The Pro version is still in beta (available on request).  To access Ofir Blue Lite, go to Telegram and open the bot @OfirBlueLite. All demos, tutorials and docs are available in Telegram. Join the Telegram group @OfirBlueUserGroup to get updated information and support. Features: Dashboard  ️ Account summary ️» Profit of the day ️»
FREE
Airplane   Trend   entry points should be used as potential market reversal points. The indicator works using the cyclic-wave dependence function. Thus, all entry points will be optimal points where the movement changes. The simplest way to use the indicator is to open a trade in the direction of an existing trend. The best result is obtained by combining the indicator with fundamental news, it can act as a news filter, that is, it can show how the market reacts to this or that news. The de
Description The base of this indicator is an ZigZag algorithm based on ATR and Fibo retracement. The ZigZag can be drawn like a classic ZigZag or like Arrows or needn't be drawn at all. This indicator is not redrawing in sense that the ZigZag's last shoulder is formed right after the appropriate conditions occur on the market. The shoulder doesn't change its direction afterwards (can only continue). There are some other possibilities to show advanced information in this indicator: Auto Fibo on
The Envelopes indicator determines the presence of a trend or flat. It has 3 types of signals, shows the probable retracement levels and levels of the possible targets. The Fibonacci coefficients are used in the indicator's calculations. Signals   (generated when touching the lines or rebounding from lines): Trend   - the middle line of the Envelopes has a distinct inclination; the lines below the channel's middle line are used for buy trades, the lines above the middle line and the middle line
The indicator plots flexible support and resistance levels (dots). A special phase of movement is used for construction. Levels are formed dynamically, that is, each new candle can continue the level or complete it. The level can provide resistance or support to the price even where it is no longer there. Also, support and resistance levels can change roles. The importance of levels is affected by: the amount of time the level is formed and the number of touches. The significance of these l
Enhance your price action strategy: inside bar breakouts at your fingertips This indicator detects inside bars of several ranges, making it very easy for price action traders to spot and act on inside bar breakouts. [ Installation Guide | Update Guide | Troubleshooting | FAQ | All Products ] Easy to use and understand Customizable color selections The indicator implements visual/mail/push/sound alerts The indicator does not repaint or backpaint An inside bar is a bar or series of bars which is/
Unlock the Precision of Market Movements with OrderBlock Precision Trader Welcome to the future of trading, where precision meets profitability. OrderBlock Precision Trader is not just an expert advisor; it's your personal trading ally designed to elevate your strategies and optimize your results. Packed with advanced features and a comprehensive trading approach, this EA opens the door to a new era of trading excellence. Are you ready to elevate your trading game and gain an edge in the fin
Renko graph The Renko indicator in the main chart window at the location with the current price. The indicator displays price changes in the form of rectangles ("bricks") against the background of a regular quote chart. The upward movement of the price, by the number of points specified in the settings, is marked by adding above the previous next rectangle, and downward movement - below the previous rectangle. The indicator is designed to visually identify the main trend. Used to identify key su
神奇九转, 顾名思义就是每当出现数字9时,行情就很大的几率会发生逆转,这时应该注意止盈。是一个很有效的指标。 在序列显示和形成过程中,一旦出现不符合触发条件的情况,则前面序列数字消失,本次九转序列结构不存在。如果连续九天都达到触发条件,九转序列结构形成,价格走势可能发生反转。 九转序列可分为上升九转结构和下降九转结构,也就是九转序列在买多和买空以及判断各种走势反转是都可以使用。 九转序列买入建仓,即下降九转序列结构形成时,价格走势将要发生转变,考虑建仓买入。 买入条件:连续出现九根K线,并且满足收盘价都低于前一根K线收盘价,当第8、9根K线满足上述条件时,九转序列形成,投资者准备买入建仓。 使用分时九转时需要注意两点: 1、极端行情时(连续上涨或下跌),九转序列失效; 2、当九转序列完全形成时,再进场操作(尤其不用刚出现数字8或9就入场,一定要完全形成之后才可以。)
Gartley Projections D
Oleksandr Medviediev
3 (2)
The indicator identifies the harmonic patterns (XABCD) according to developments of H.M.Gartley ( "Profits in the Stock Market" , 1935г). It projects D-point as a point in the perspective projection (specify ProjectionD_Mode = true in the settings). Does not redraw. When a bar of the working timeframe closes, if the identified pattern point has not moved during Patterns_Fractal_Bars bars, an arrow appears on the chart (in the direction of the expected price movement). From this moment on, the ar
The MP Andean Oscillator is used to estimate the direction and also the degree of variations of trends. It contains 3 components: Bull component, Bear component and Signal component. A rising Bull component indicates that the market is up-trending while a rising Bear component indicates the presence of down-trending market. Settings: Oscillator period: Specifies the importance of the trends degree of variations measured by the indicator. Signal line per: Moving average period of the Signal line
FREE
Introduction One of the patterns in "RTM" is the "QM" pattern, also known as "Quasimodo". Its name is derived from the appearance of "Hunchback of Notre-Dame" from Victor Hugo's novel. It is a type of "Head and Shoulders" pattern.   Formation Method   Upward Trend In an upward trend, the left shoulder is formed, and the price creates a new peak higher than the left shoulder peak . After a decline, it manages to break the previous low and move upward again. We expect the pric
The Penta-O is a 6-point retracement harmonacci pattern which usually precedes big market movements. Penta-O patterns can expand and repaint quite a bit. To make things easier this indicator implements a twist: it waits for a donchian breakout in the right direction before signaling the trade. The end result is an otherwise repainting indicator with a very reliable trading signal. The donchian breakout period is entered as an input. [ Installation Guide | Update Guide | Troubleshooting | FAQ | A
The   Visual Volatility Clustering   indicator clusters the market based on volatility. The indicator does not redraw and gives accurate data, does not use closing prices. Uses the opening prices or the highs or lows of the previous completed bar. Therefore, all information will be clear and unambiguous. The essence of the indicator is to divide the price market into certain areas according to a similar type of volatility. This can be done in any way. In this example, the indicator is configure
AI forex robot is an advanced trading tool that utilizes sophisticated algorithms and machine learning techniques to analyze market data and make informed trading decisions. One of the key indicators it uses is the envelopes indicator, which plots a pair of parallel lines, usually representing a standard deviation away from a moving average. This indicator helps the robot to identify potential trend reversals or breakouts by highlighting areas of support and resistance. By continuously monitorin
Description of the Indicator Trend Stop shows the highest/lowest value of the last N periods. Can help traders identify the trend direction and potential stop levels.    Use Trend Stop indicator to detects the trend direction. Downtrend if the price crosses the Trend Stop line upwards  Uptrend if the price crosses the Trend Stop line downwards  Use Trend Stop indicator to  define  optimal stop levels. Downtrend Place your stops  above the Trend Stop line Uptrend Place your stops below the Tr
Brekaut
Kwuemeka Kingsle Anyanwu
Brekaut, a powerful and intuitive trading indicator designed to take your trading experience to the next level. Built to simplify market analysis and provide timely insights, Brekaut offers traders a reliable way to identify key breakout opportunities across various asset classes, including stocks, forex, and cryptocurrencies. Brekaut cuts through the noise by highlighting potential breakout points where the market is poised for strong movement. This allows traders to make informed decisions
FREE
Trade system "PAX Multi TMA/HMA 8" for MT5 It is a ready-made trading system for trading on any instrument and any timeframe. Completely ready for manual trading and use in robots. Not redrawn signals ( See the picture ) It is convenient to work on any timeframe. Tested on metals, currency pairs, oil, international stocks, Russian stocks, cryptocurrencies, monetary and cryptocurrency indices. What the trading system consists of: 1. The main channel of price movement named Medi
Di Napoli MACD MT5
Samil Bozuyuk
4.6 (5)
Non-proprietary study of Joe Dinapoli used for trend analysis. The indicator gives trend signals when the fast line penetrates the slow line. These signals remain intact until another penetration occurs. The signal is confirmed at the close of the period. It is applicable for all timeframes.   Parameters Fast EMA: period of the fast moving average. Slow EMA: period of the slow moving average. Signal EMA: period of the signal line.                              ************************************
FREE
Micro MACD
Aleksandr Goryachev
MACD  ******************** MACD для платформы секундных графиков Micro . ********************* Секундный график на порядок увеличит точность ваших входов и выходов. Секундный период , в привычном формате,   позволит увидеть то, что ранее было скрыто. Бесплатные индикаторы, дополнят визуальную картину, что, в совокупности выведет вашу торговлю на новый уровень. Идеально подходит как скальперам, так и трейдерам торгующим внутри дня.  Индикатор  MACD для платформы Micro. Входные параметры:
FREE
Consecutive candles can give us an indication as to the strength of a trend. With this indicator, you can set the number of consecutive bull or bear candles you wish to be present before achieving a valid signal of RSI crossing into overbought or oversold. With this information, you can better judge if a continuation or reversal situation is about to present. RSI has two settable levels Interesting settings: Number of consecutive candles needed before a valid signal Overbought level of RSI Ove
FREE
Gli utenti di questo prodotto hanno anche acquistato
TPSpro RFI Levels MT5
Roman Podpora
4.75 (12)
ISTRUZIONI       RUS   -   INGLESE       Si   consiglia di utilizzare con un indicatore       -       TPSpro   TENDENZA PRO -   Versione MT4         Un elemento chiave nel trading sono le zone o i livelli da cui vengono prese le decisioni di acquisto o vendita di uno strumento di trading. Nonostante i tentativi dei principali attori di nascondere la loro presenza sul mercato, lasciano inevitabilmente delle tracce. Il nostro compito era imparare a identificare queste tracce e interpretarle corre
TPSproTREND PrO MT5
Roman Podpora
4.89 (9)
TPSpro TREND PRO   è un indicatore di tendenza che analizza automaticamente il mercato, fornisce informazioni sulla tendenza e sui rispettivi cambiamenti e fornisce segnali per entrare nelle operazioni senza ridisegnare. L'indicatore utilizza ciascuna candela e la analizza separatamente. Si riferisce a vari shock al rialzo o al ribasso. Punto di ingresso preciso per il trading di valute, criptovalute, metalli, azioni e indici! Versione MT5                   Descrizione completa dell'indicatore
Top indicator for MT5   providing accurate signals to enter a trade without repainting! It can be applied to any financial assets:   forex, cryptocurrencies, metals, stocks, indices .  Watch  the video  (6:22) with an example of processing only one signal that paid off the indicator! MT4 version is here It will provide pretty accurate trading signals and tell you when it's best to open a trade and close it. Most traders improve their trading results during the first trading week with the help of
FX Volume MT5
Daniel Stein
4.93 (14)
Ricevi il tuo aggiornamento quotidiano sul mercato con dettagli e schermate tramite il nostro Morning Briefing qui su mql5 e su Telegram ! FX Volume è il PRIMO e UNICO indicatore di volume che fornisce una visione REALE del sentiment del mercato dal punto di vista del broker. Fornisce informazioni straordinarie su come gli operatori di mercato istituzionali, come i broker, sono posizionati sul mercato Forex, molto più velocemente dei rapporti COT. Vedere queste informazioni direttamente sul vo
Presentazione       Quantum Breakout PRO   , l'innovativo indicatore MQL5 che sta trasformando il modo in cui scambi le zone di breakout! Sviluppato da un team di trader esperti con un'esperienza di trading di oltre 13 anni,       Quantum Breakout PRO       è progettato per spingere il tuo viaggio di trading a nuovi livelli con la sua strategia innovativa e dinamica della zona di breakout. Quantum Breakout Indicator ti fornirà frecce di segnalazione sulle zone di breakout con 5 zone target
TPA True Price Action indicator reveals the true price action of the market makers through 100% non-repainting signals strictly at the close of a candle! TPA shows entries and re-entries, every time the bulls are definitely stronger than the bears and vice versa. Not to confuse with red/green candles. The shift of power gets confirmed at the earliest stage and is ONE exit strategy of several. There are available now two free parts of the TPA User Guide for our customers. The first "The Basics"
Quantum Trend Sniper
Bogdan Ion Puscasu
4.8 (49)
Presentazione       Quantum Trend Sniper Indicator   , l'innovativo indicatore MQL5 che sta trasformando il modo in cui identifichi e scambi le inversioni di tendenza! Sviluppato da un team di trader esperti con un'esperienza di trading di oltre 13 anni,       Indicatore Quantum Trend Sniper       è progettato per spingere il tuo viaggio di trading verso nuove vette con il suo modo innovativo di identificare le inversioni di tendenza con una precisione estremamente elevata. *** Acquista Quant
Ora $ 147 (aumentando a $ 499 dopo alcuni aggiornamenti) - account illimitati (PC o MAC) Manuale utente di RelicusRoad + Video di formazione + Accesso al gruppo Discord privato + Stato VIP UN NUOVO MODO DI GUARDARE IL MERCATO RelicusRoad è l'indicatore di trading più potente al mondo per forex, futures, criptovalute, azioni e indici, fornendo ai trader tutte le informazioni e gli strumenti di cui hanno bisogno per rimanere redditizi. Forniamo analisi tecniche e piani di trading per aiutar
PTS - Divergence Buy Finder di Precision Trading Systems Il Precision Divergence Finder è stato progettato per individuare i minimi di mercato con estrema precisione e lo fa frequentemente. Nell'analisi tecnica, l'arte di individuare i minimi di mercato è generalmente molto più semplice rispetto a individuare i massimi, e questo strumento è progettato appositamente per questa finalità. Dopo aver identificato una divergenza rialzista, è saggio attendere che la tendenza si inverta prima di ac
Advanced Supply Demand MT5
Bernhard Schweigert
4.5 (14)
La migliore soluzione per qualsiasi principiante o trader esperto! Questo indicatore è uno strumento di trading unico, di alta qualità e conveniente perché abbiamo incorporato una serie di funzionalità proprietarie e una nuova formula. Con questo aggiornamento, sarai in grado di mostrare fusi orari doppi. Non solo potrai mostrare una TF più alta, ma anche entrambe, la TF del grafico, PIÙ la TF più alta: SHOWING NESTED ZONES. Tutti i trader di domanda di offerta lo adoreranno. :) Informazioni imp
FxaccurateLS
Shiv Raj Kumawat
WHY IS OUR FXACCCURATE LS MT5 THE PROFITABLE ? PROTECT YOUR CAPITAL WITH RISK MANAGEMENT Gives entry, stop and target levels from time to time. It finds Trading opportunities by analyzing what the price is doing during established trends. POWERFUL INDICATOR FOR A RELIABLE STRATEGIES We have made these indicators with a lot of years of hard work. It is made at a very advanced level. Established trends provide dozens of trading opportunities, but most trend indicators completely ignore them!
Introducing the POWER TRADE indicator created by a small group of traders with a few years trading trading the financial market profitably . This is a plug and play indicator that provides you with  POWERFUL Entry signals with Profit Taking and rebound zones. The indicator Works with all MT5 trading instruments. The indicator uses previous  chart data as receipt to speculate on future market moves.
First of all Its worth emphasizing here that this Trading indicator is   Non-Repainting   , Non Redrawing and Non Lagging Indicator   Which makes it ideal from both manual and robot trading .  Viking Strategy Signal Indicator  - is a trend indicator that automatically analyzes the market and provides information about the trend and each of its changes, as well as giving signals for entering trades without redrawing! . Exact entry points into transactions for currencies, crypto, metals, stock
PZ Swing Trading MT5
PZ TRADING SLU
5 (4)
Protect against whipsaws: revolutionize your swing trading approach Special Offer: Purchase now to receive free bonuses worth $135! (Read more for details) Swing Trading is the first indicator designed to detect swings in the direction of the trend and possible reversal swings. It uses the baseline swing trading approach, widely described in trading literature. The indicator studies several price and time vectors to track the aggregate trend direction and detects situations in which the market i
AT Forex Indicator MT5
Marzena Maria Szmit
5 (4)
The AT Forex Indicator MT5 is a sophisticated trading tool designed to provide traders with a comprehensive analysis of multiple currency pairs. This powerful indicator simplifies the complex nature of the forex market, making it accessible for both novice and experienced traders. AT Forex Indicator uses advanced algorithms to detect trends, patterns and is an essential tool for traders aiming to enhance their forex trading performance. With its robust features, ease of use, and reliable signal
Volume by Price MT5
Brian Collard
3.25 (4)
The Volume by Price Indicator for MetaTrader 5 features Volume Profile and Market Profile TPO (Time Price Opportunity). Volume and TPO histogram bar and line charts. Volume Footprint charts. TPO letter and block marker collapsed and split structure charts. Static, dynamic and flexible range segmentation and compositing methods with relative and absolute visualizations. Session hours filtering and segment concatenation with Market Watch and custom user specifications. Graphical layering, positio
Satoro mt5
Mykhailo Lozhkin
5 (1)
An indicator based on time-tested trading methods that gives a signal that the market is overbought or oversold in a certain period of time The indicator does not disappear when it appears, easy to use Suitable for any trade It can be used on any currency pair or crypto He performed best in the period H1,H4,daily After the purchase, you will also receive a seller's template with settings The seller uses it more for trading on cryptocurrency After the purchase, I also keep in touch
L'indicatore Quadrato di Gann è uno strumento potente di analisi di mercato basato sull'articolo "Formula Matematica per le Previsioni di Mercato" scritto da W.D. Gann. Questo strumento utilizza concetti matematici e teorie di Gann per effettuare un'analisi precisa del mercato. Utilizza i quadrati di 144, 90, 52 e anche il quadrato di 9. Inoltre, integra il metodo del  per il quadrato di 9 e la sua relazione con canali e modelli stellari di quel quadrato. Manuale Utente e Applicazione: Prima di
FX Market Correlation indicator calculates the weakness/strength from all 28 currency pairs in the market. This is unique and powerful way of watching the market. It works on all timeframes. You can use it for scalping, or you can use it for long term trading. FX Market Correlation indicator is NOT repainting. Features: --------- -easy determine which currency is strengthening and which is weakening -choose best currency pairs to trade and times to trade them -find correlation between pairs -N
Scalping Tool for Deriv Description: This trading indicator is designed for traders specializing in scalping. It provides signals for trading in the direction of short-term price movements. The indicator is optimized for use on the M1 timeframe and supports Boom and Crash indices (300, 500, 1000). The indicator will be sold in a limited quantity. Features: Trading direction: towards short-term price movements. Filters and indicators: Reaction volume indicator: displays activity zones. Trend i
TrendMaestro5
Stefano Frisetti
nota: questo indicatore e' per METATRADER5, se vuoi la versione per  METATRADER4 questo e' il link:   https://www.mql5.com/it/market/product/108106 TRENDMAESTRO ver 2.4 TRENDMAESTRO   riconosce un nuovo TREND sul nascere, non sbaglia mai. La sicurezza di identificare un nuovo TREND non ha prezzo. DESCRIZIONE TRENDMAESTRO identifica un nuovo TREND sul nascere, questo indicatore prende in esame la volatilita' i volumi ed il momentum per identificare il momento in cui c'e' un'esplosione di uno
La soluzione migliore per ogni principiante o trader esperto! Questo indicatore è uno strumento di trading unico, di alta qualità e conveniente perché abbiamo incorporato una serie di caratteristiche proprietarie e una nuova formula. Con un solo grafico è possibile leggere la forza delle valute per 28 coppie Forex! Immaginate come migliorerà il vostro trading perché sarete in grado di individuare l'esatto punto di innesco di una nuova tendenza o di un'opportunità di scalping? Manuale d'uso:
XQ Indicator MetaTrader 5
Marzena Maria Szmit
3 (2)
Step into the realm of Forex trading with confidence and precision using XQ, a cutting-edge Forex indicator designed to elevate your trading game to unprecedented heights. Whether you're a seasoned trader or just stepping into the world of currency exchange, XQ Forex Indicator empowers you with the insights and signals needed to make informed trading decisions. The signal conditions are a combination of three indicators, and XQ Forex Indicator only display  medium and long-term trends . The ind
Fxaccurate TCT
Shiv Raj Kumawat
WHY IS OUR FXACCCURATE TCT MT5 THE PROFITABLE ? Gives entry, stop and target levels from time to time. It finds Trading opportunities by analyzing what the price is doing during established trends. We have made these indicators with a lot of years of hard work. It is made at a very advanced level. Established trends provide dozens of trading opportunities, but most trend indicators completely ignore them! The trend reveals trading indicator represents an average of 10 different trades per trend
Trade smarter, not harder: Empower your trading with Harmonacci Patterns Special Offer: Purchase now to receive free bonuses worth $165! (Read more for details) This is arguably the most complete harmonic price formation auto-recognition indicator you can find for the MetaTrader Platform. It detects 19 different patterns, takes fibonacci projections as seriously as you do, displays the Potential Reversal Zone (PRZ) and finds suitable stop-loss and take-profit levels. [ Installation Guide | Up
Alla ricerca di un potente indicatore di trading forex che possa aiutarti a identificare facilmente opportunità di trading redditizie? Non guardare oltre il Super Segnale Bestia. Questo indicatore basato sulle tendenze di facile utilizzo monitora continuamente le condizioni del mercato, cercando nuove tendenze in via di sviluppo o saltando su quelle esistenti. Il Beast Super Signal fornisce un segnale di acquisto o di vendita quando tutte le strategie interne sono allineate e sono al 100% in con
GannRS Trend Scalper   GannRS is an advanced trading tool based on Gann Law and Supports and Resistances. designed to have an   active trading at any time not lagging Indications are given at the beginning of a new candle Please watch the full tutorial video. How to use GannRS Very easy to set up... Put it on your chart Adjust inputs Inputs Show Resistance and support : [bool]  true = Shows R/S on chart false = does not show Show Levels :[bool]  true = Shows levels on the chart false = doe
Bill Williams Advanced
Siarhei Vashchylka
5 (8)
Bill Williams Advanced is designed for automatic chart analysis using Bill Williams' "Profitunity" system. The indicator analyzes four timeframes at once. Manual (Be sure to read before purchasing) Advantages 1. Automatically analyzes the chart using the "Profitunity" system of Bill Williams. The found signals are placed in a table in the corner of the screen. 2. Equipped with a trend filter based on the Alligator indicator. Most of the system signals are recommended to be used only accordi
[ MT4 Version ] Only the next 10 units at current price! Final price: $299 Are you tired of spending months on demo or live accounts to test your trading strategies? The Backtesting Simulator is the ultimate tool designed to elevate your backtesting experience to new heights. Utilizing Metatrader historical symbol information, it offers an unparalleled simulation of real market conditions. Take control of your testing speed, test ideas quickly or at a slower pace, and witness remarkable improve
The Price Action Finder Multi indicator is an indicator of entry points that searches for and displays Price Action system patterns on dozens of trading instruments and on all standard time frames: (m1, m5, m15, m30, H1, H4, D1, Wk, Mn). The indicator places the found patterns in a table at the bottom of the screen. By clicking on the pattern names in the table, you can move to the chart where this pattern is located. Manual (Be sure to read before purchasing) | Version for MT4 Advantages 1. Pa
Altri dall’autore
Every indicator has its advantages and disadvantages. Trending ones show good signals during a trend, but lag during a flat. Flat ones thrive in the flat, but die off as soon as a trend comes. All this would not be a problem, if it was easy to predict when a flat changes to a trend and when a trend changes to a flat, but in practice it is an extremely serious task. What if you develop such an algorithm, which could eliminate an indicator's flaws and enhance its strengths? What if such an algorit
The B150 model is a fully revised version of the Historical Memory indicator with an improved search algorithm. It also features a graphical interface what makes working with this tool quick and convenient. Indicator-forecaster. Very useful as an assistant, acts as a key point to forecast the future price movement. The forecast is made using the method of searching the most similar part in the history (patter). The indicator is drawn as a line that shows the result of change of the close price o
Historical Memory
Marat Sultanov
4 (2)
Indicator-forecaster. Very useful as an assistant, acts as a key point to forecast the future price movement. The forecast is made using the method of searching the most similar part in the history (pattern). The indicator is drawn as a line that shows the result of change of the close price of bars. The depth of history, the number of bars in the forecast, the patter size and the quality of search can be adjusted via the indicator settings. Settings: PATTERN_Accuracy_ - quality of the search.
FREE
ACI Bollinger Bands
Marat Sultanov
4 (3)
Tired of adjusting the indicator settings losing precious time? Tired of the uncertainty regarding their efficiency? Afraid of the uncertainty in their profitability? Then the indicator ACI (automatically calibrateable indicator) is designed exactly for you. Launching it, you can easily solve these three issues just performing the simplest action: clicking a single Calibrate button. To achieve the highest efficiency, you should perform another additional action: move the power slider to the maxi
FREE
Do you want to see the future lines of the ZigZag indicator? This indicator will help you do that because the indicator model is based on two indicators: Historical Memory and ZigZag. So it can forecast the ZigZag lines. Very useful as an assistant, acts as a key point to forecast the future price movement. The forecast is made using the method of searching the most similar part in the history (pattern) to the current one.  The indicator is drawn as a line that shows the result of change of the
ACI Moving Average
Marat Sultanov
4 (2)
Tired of adjusting the indicator settings losing precious time? Tired of the uncertainty regarding their efficiency? Afraid of the uncertainty in their profitability? Then the indicator ACI (automatically calibrateable indicator) is designed exactly for you. Launching it, you can easily solve these three issues just performing the simplest action: clicking a single Calibrate button. To achieve the highest efficiency, you should perform another additional action: move the power slider to the maxi
FREE
Every indicator has its advantages and disadvantages. Trending ones show good signals during a trend, but lag during a flat. Flat ones thrive in the flat, but die off as soon as a trend comes. All this would not be a problem, if it was easy to predict when a flat changes to a trend and when a trend changes to a flat, but in practice it is an extremely serious task. What if you develop such an algorithm, which could eliminate an indicator's flaws and enhance its strengths? What if such an algori
Do you want to see the future lines of the ZigZag indicator? This indicator will help you do that because the indicator model is based on two indicators:   Historical Memory   and ZigZag. So it can forecast the ZigZag lines. Very useful as an assistant, acts as a key point to forecast the future price movement. The forecast is made using the method of searching the most similar part in the history (pattern)   to the current one.  The indicator is drawn as a line that shows the result of change o
The B150 model is a fully revised version of the Historical Memory indicator with a significantly improved algorithm. It also features a graphical interface what makes working with this perfect tool quick and convenient. Indicator-forecaster. Very useful as an assistant, acts as a key point to forecast the future price movement. The forecast is made using the method of searching the most similar part in the history (patter). The indicator is drawn as a line that shows the result of change of the
Deep Moving Average
Marat Sultanov
5 (1)
Every indicator has its advantages and disadvantages. Trending ones show good signals during a trend, but lag during a flat. Flat ones thrive in the flat, but die off as soon as a trend comes. All this would not be a problem, if it was easy to predict when a flat changes to a trend and when a trend changes to a flat, but in practice it is an extremely serious task. What if you develop such an algorithm, which could eliminate an indicator's flaws and enhance its strengths? What if such an algori
Every indicator has its advantages and disadvantages. Trending ones show good signals during a trend, but lag during a flat. Flat ones thrive in the flat, but die off as soon as a trend comes. All this would not be a problem, if it was easy to predict when a flat changes to a trend and when a trend changes to a flat, but in practice it is an extremely serious task. What if you develop such an algorithm, which could eliminate an indicator's flaws and enhance its strengths? What if such an algorit
Do you want to know how an economic event will impact price? What will happen to price after the news? How has an economic news affected price in the past? This indicator can help you with that. Do you like technical analysis? Do you enjoy studying the history to predict the future? But what do you think could be more important than technical analysis, what could improve technical analysis? Of course, it's fundamental analysis! After all, economic events directly impact the market, and theref
Do you want to know how an economic event will impact price? What will happen to price after the news? How has an economic news affected price in the past? This indicator can help you with that. Do you like technical analysis? Do you enjoy studying the tick history to predict the future? But what do you think could be more important than technical analysis, what could improve technical analysis? Of course, it's fundamental analysis! After all, economic events directly impact the market, and t
Filtro:
Nessuna recensione
Rispondi alla recensione