Line Breakouts
- Indicatori
- Vitalyi Belyh
- Versione: 1.10
- Aggiornato: 16 settembre 2023
- Attivazioni: 7
Line Breakouts - Sistema per il trading di trend.
Contiene un identificatore di tendenza che può essere adattato a qualsiasi grafico e strumento di trading utilizzando la funzione periodo e livellamento.
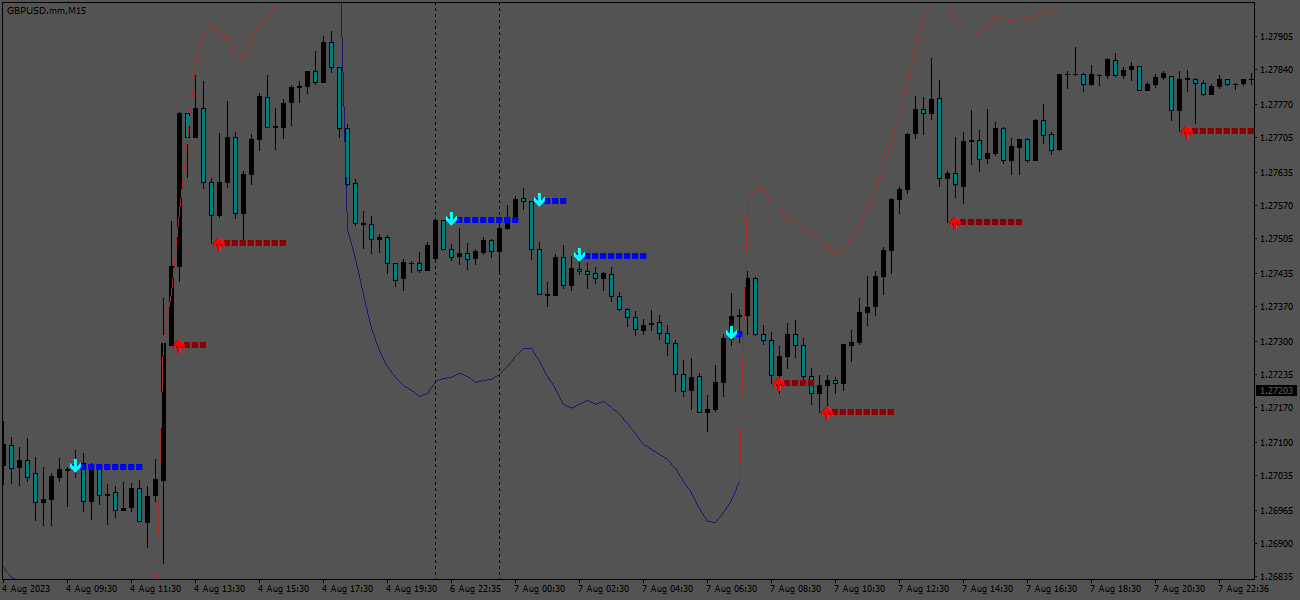
E un determinante dei livelli di supporto e resistenza. Quando il prezzo è al di sotto della linea di resistenza, apri le operazioni di vendita e quando il prezzo è al di sopra della linea di supporto, apri le operazioni di acquisto. Lo stop loss dovrebbe essere posizionato a pochi punti dalle linee, il Take Profit dovrebbe essere fissato dopo diverse candele (3-10-15), in base al time frame.
L'indicatore non viene ridisegnato. L'inizio della riga può fornire diversi tipi di avvisi.
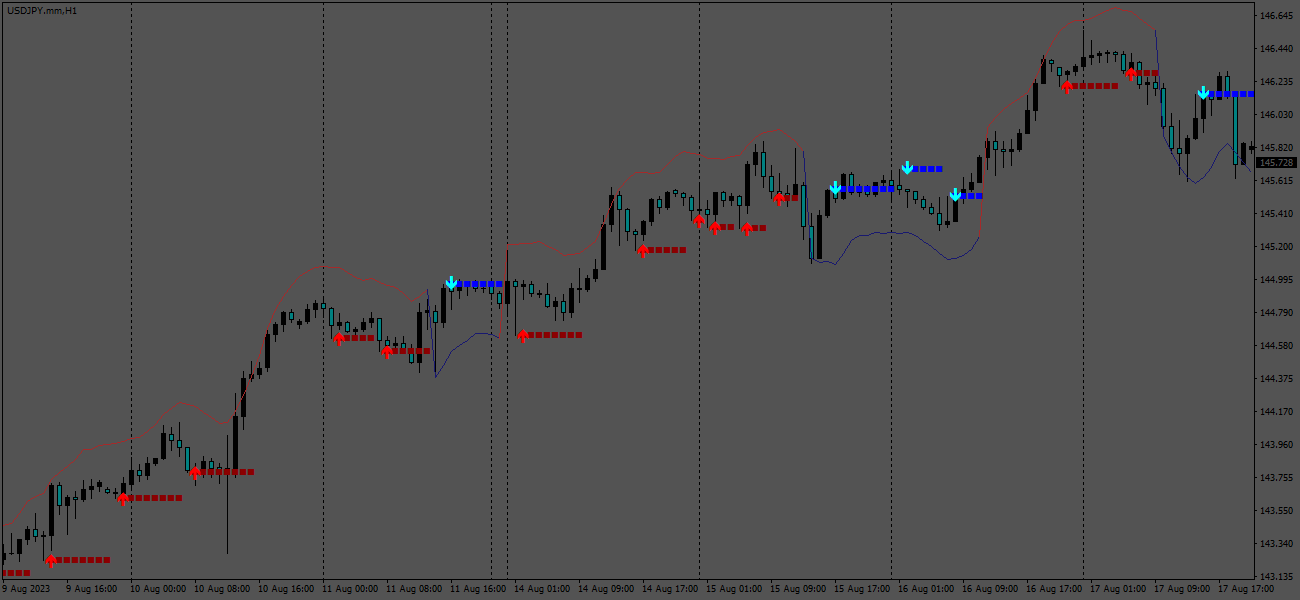
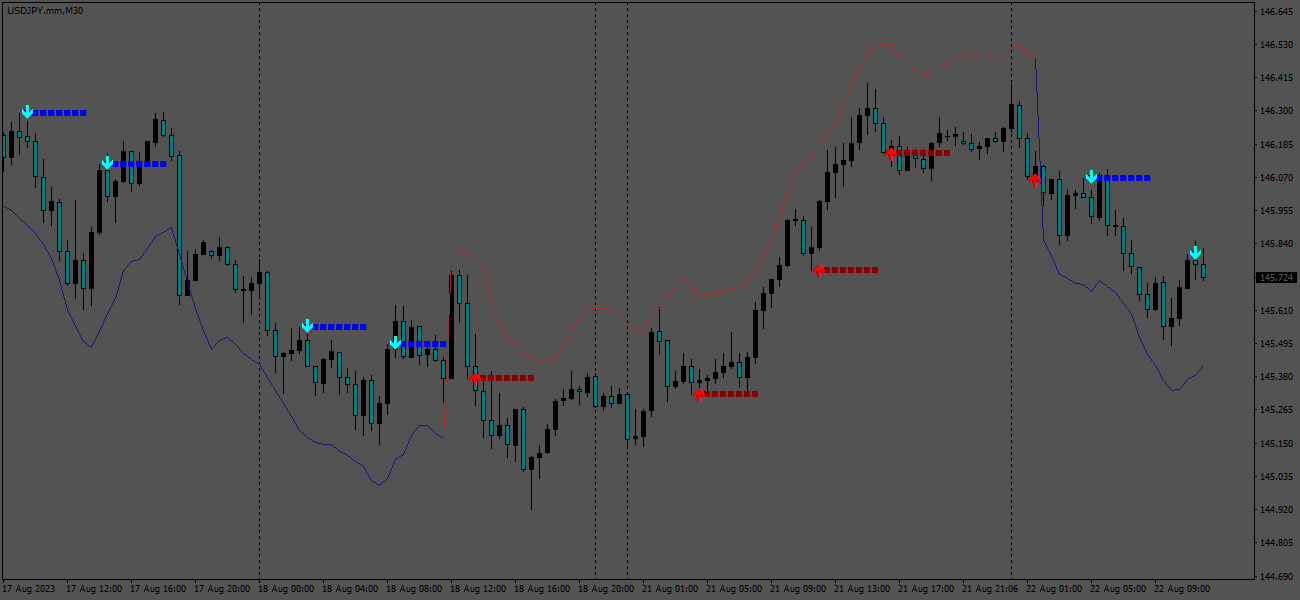
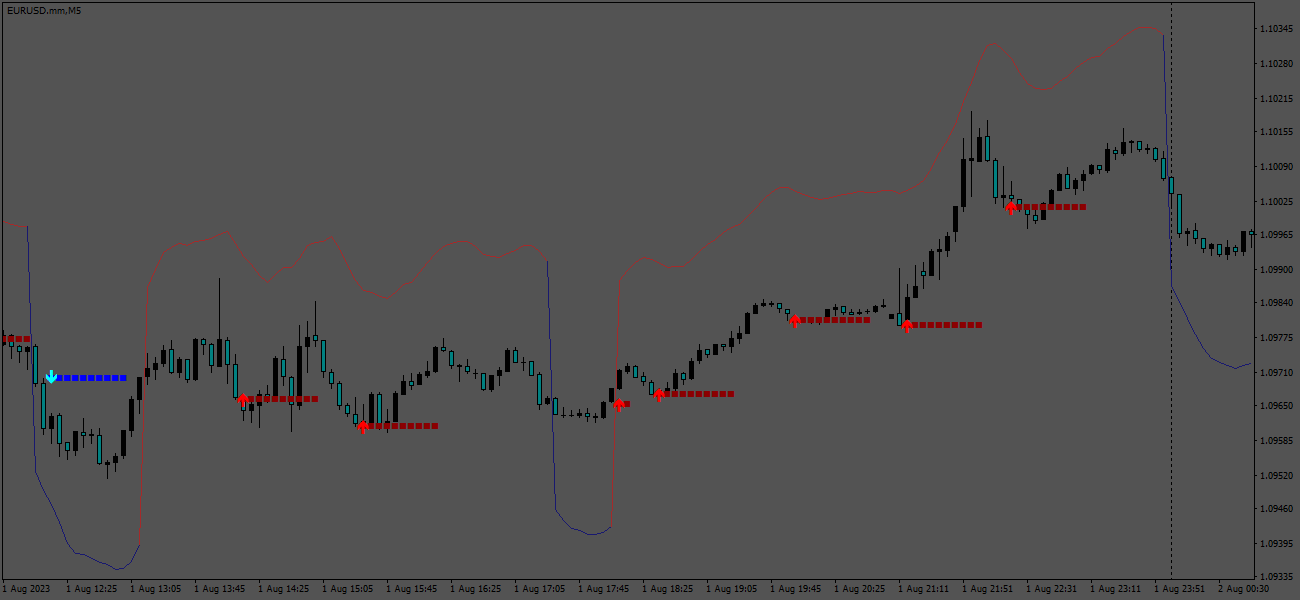
Il sistema di trading viene utilizzato al meglio sugli intervalli di tempo M15, M30 e H1, ma è possibile utilizzarne altri.
I parametri principali delle linee di supporto e resistenza sono già stati calcolati e funzionano automaticamente; con un numero basso di livelli è possibile solo aggiungere sensibilità.
I parametri del trend sono ottimali per gli intervalli temporali M15, M30 e H1, per gli altri è opportuno modificare i valori.
Cosa mostra l'indicatore
Parametri di input
Contiene un identificatore di tendenza che può essere adattato a qualsiasi grafico e strumento di trading utilizzando la funzione periodo e livellamento.
E un determinante dei livelli di supporto e resistenza. Quando il prezzo è al di sotto della linea di resistenza, apri le operazioni di vendita e quando il prezzo è al di sopra della linea di supporto, apri le operazioni di acquisto. Lo stop loss dovrebbe essere posizionato a pochi punti dalle linee, il Take Profit dovrebbe essere fissato dopo diverse candele (3-10-15), in base al time frame.
L'indicatore non viene ridisegnato. L'inizio della riga può fornire diversi tipi di avvisi.
Il sistema di trading viene utilizzato al meglio sugli intervalli di tempo M15, M30 e H1, ma è possibile utilizzarne altri.
I parametri principali delle linee di supporto e resistenza sono già stati calcolati e funzionano automaticamente; con un numero basso di livelli è possibile solo aggiungere sensibilità.
I parametri del trend sono ottimali per gli intervalli temporali M15, M30 e H1, per gli altri è opportuno modificare i valori.
Cosa mostra l'indicatore
- Linea di tendenza marrone: tendenza al rialzo, i livelli di supporto sono rossi.
- Linea di tendenza blu scuro: tendenza al ribasso, i livelli di supporto sono blu.
Parametri di input
- Trend Period : numero di barre per calcolare il trend.
- Noise Smoothing : opzione di smoothing del trend in caso di rumore di mercato elevato.
- Visible Trend Line Deviation : la deviazione della linea di tendenza dal grafico non influisce sui calcoli.
- Sensitivity Enhancer : aumenta la sensibilità del calcolo delle linee di supporto e resistenza.
- Bars Count : numero di barre indicatrici sul grafico.
- Play sound / Display pop-up message / Send push notification / Send email : utilizza le notifiche quando vengono visualizzati i punti di segnale.
- Sound file signal : file audio per la freccia del segnale.