Hx Stochastic
- Indicatori
- Mateus Cerqueira Lopes
- Versione: 1.0
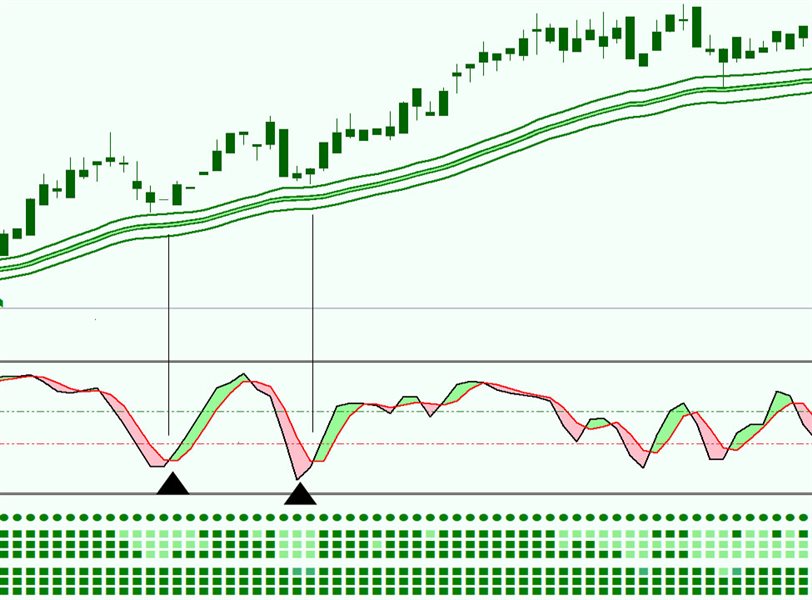
The Stochastic Oscillator is one of the main indicators used in the analysis of financial assets. It is one of the highlights in the study of price movements and can be an important indicator of changing trends in the capital market. Stochastic is an oscillator used to identify when an asset is overbought or oversold. It consists of two lines: %K, which is calculated from the highs and lows of a period, and %D, which is a moving average of %K.
Our version contains color filling, which facilitates the visualization of the crossing of %K and %D that can indicate changes in trends: when %K is above %D there is an indication of an uptrend, while when %D is above %K there is an indication of a downtrend.
In a strong trend buying now can be great entry times.


