• Panoramica
  • Recensioni (6)
  • Commenti (32)
  • Novità

Trend Forecaster

5

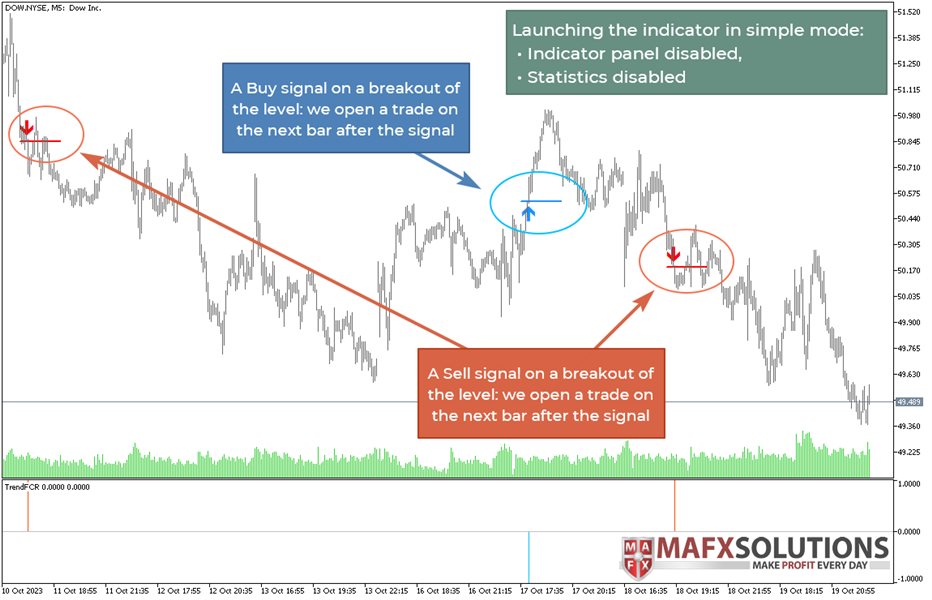
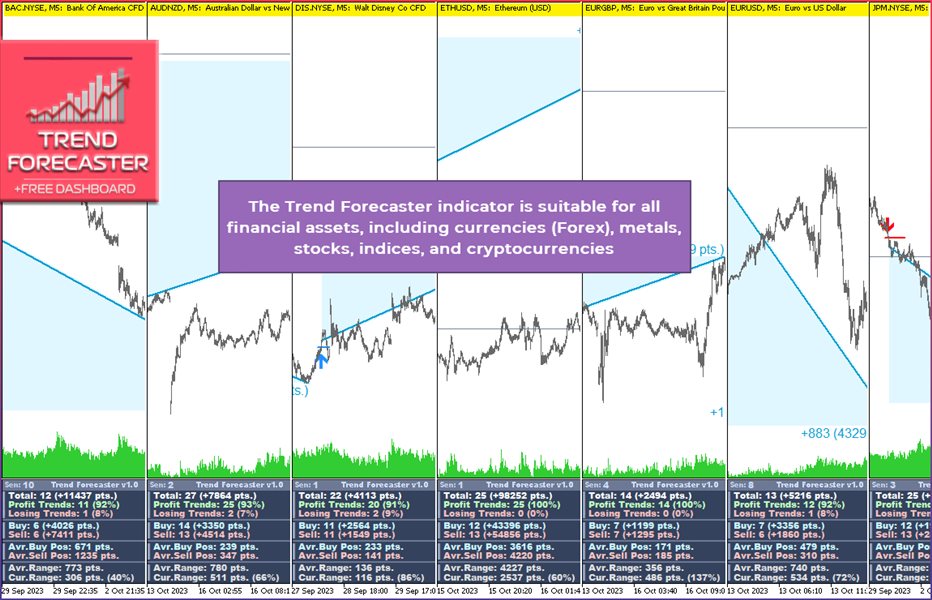
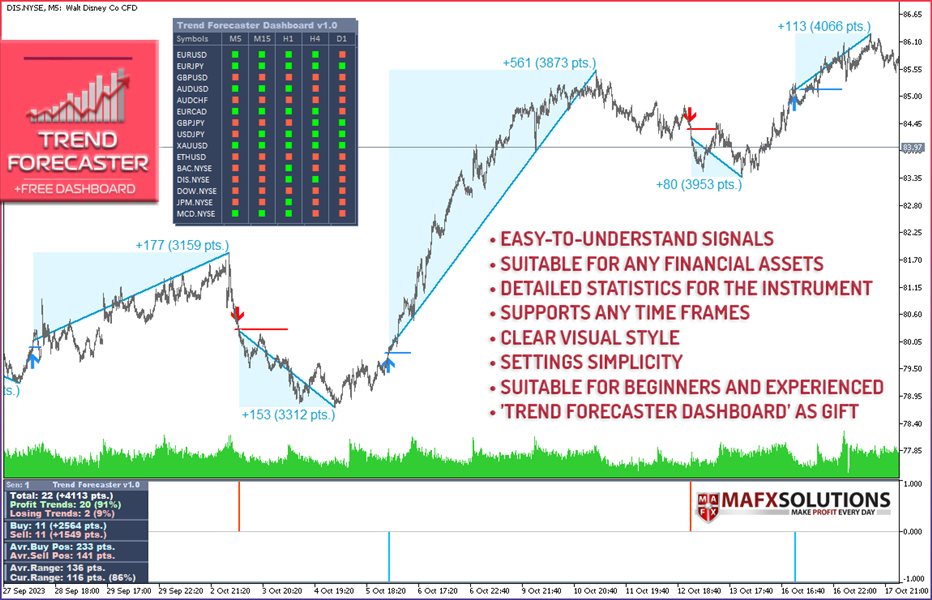
The Trend Forecaster indicator utilizes a unique proprietary algorithm to determine entry points for a breakout trading strategy. The indicator identifies price clusters, analyzes price movement near levels, and provides a signal when the price breaks through a level. The Trend Forecaster indicator is suitable for all financial assets, including currencies (Forex), metals, stocks, indices, and cryptocurrencies. You can also adjust the indicator to work on any time frames, although it is recommended to use M5 as the working time frame.

The indicator is extremely easy to set up – multiple internal algorithms are combined into a single essential variable! Add this powerful professional tool to your arsenal for identifying entry points, the current trend, and the maximum potential of any trading instrument. If you are a day trader, you can determine in advance whether it's worth opening a position or if the financial asset is already weak and you should wait for new signals.

Trend Forecaster Manual: https://www.mql5.com/en/blogs/post/754607

The Trend Forecaster indicator is a powerful professional tool that allows both novice and experienced traders to swiftly assess the current situation of a financial instrument. This indicator is built upon another of my indicators, Reversal Master for MT4, which has received numerous positive reviews. The MT5 version has been fundamentally re-worked to take advantage of the new features offered by MT5 for code analysis and optimization. Therefore, the MT5 version represents a fundamentally new product, with fresh capabilities and enhanced functionality.


Benefits of the Trend Forecaster Indicator

  • Simple and Easy-to-Understand Signals
  • You don't need to be a financial analyst to utilize Trend Forecaster signals. You receive a product that is easy to use, yet complex in terms of internal calculations and filters, which will elevate your trading to a new level.

  • Suitable for Any Financial Assets
  • Whether you trade in currencies, stocks, futures, or perhaps cryptocurrencies, all markets are at your disposal with the Trend Forecaster indicator.

  • Detailed Statistics for the Financial Instrument
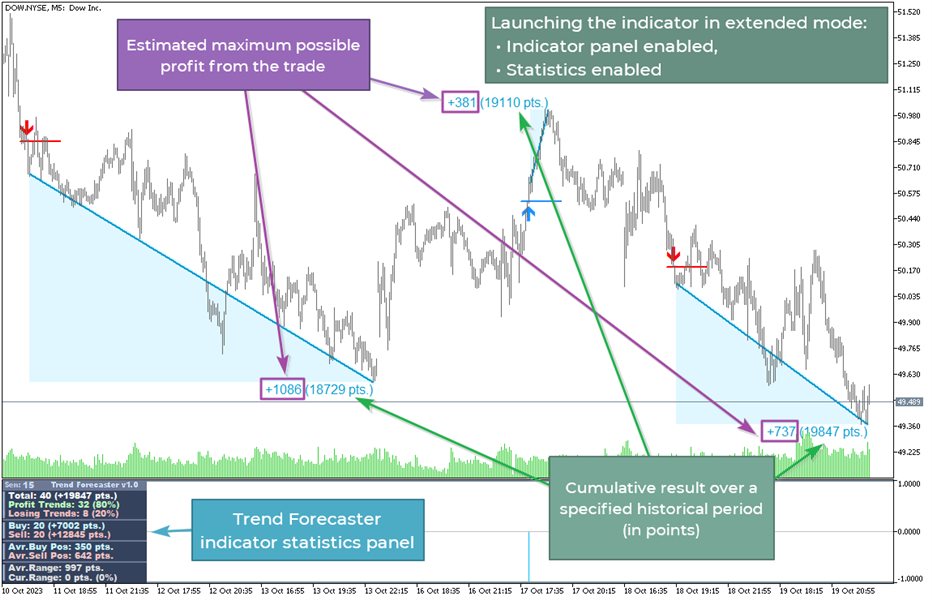
  • The Trend Forecaster indicator provides comprehensive analytics for the financial instrument. With this feature, you can quickly assess the total profit of the instrument over a specific time period, the profit potential of the instrument, and the expected profit from a trade. You can also determine whether it's worth opening a position at the moment or if the financial instrument has exhausted its potential.

  • Clear Visual Presentation of Information
  • Through collaboration with a focus group, we identified the optimal visual solutions to make the analysis process easier than ever before. Additionally, the ability to disable or toggle various modules has been preserved, allowing you to customize the visual representation of the indicator to your liking.

  • The indicator supports operation on any time frames
  • Do you trade on M1 or Daily timeframes? Or perhaps you use non-standard timeframes like M2 or H3? It doesn't matter – you can use any timeframe you prefer, easily adjusting the flat filter sensitivity with just one setting.

  • Simplicity of Configuration
  • This is an indisputable breakthrough in the field of indicator development – numerous complex calculations and functions for continuous market analysis are all concealed behind a single significant setting, the Flat Filter Sensitivity adjustment. All other settings pertain solely to the visual aspects of the indicator.

  • Availability of Various Alert Types
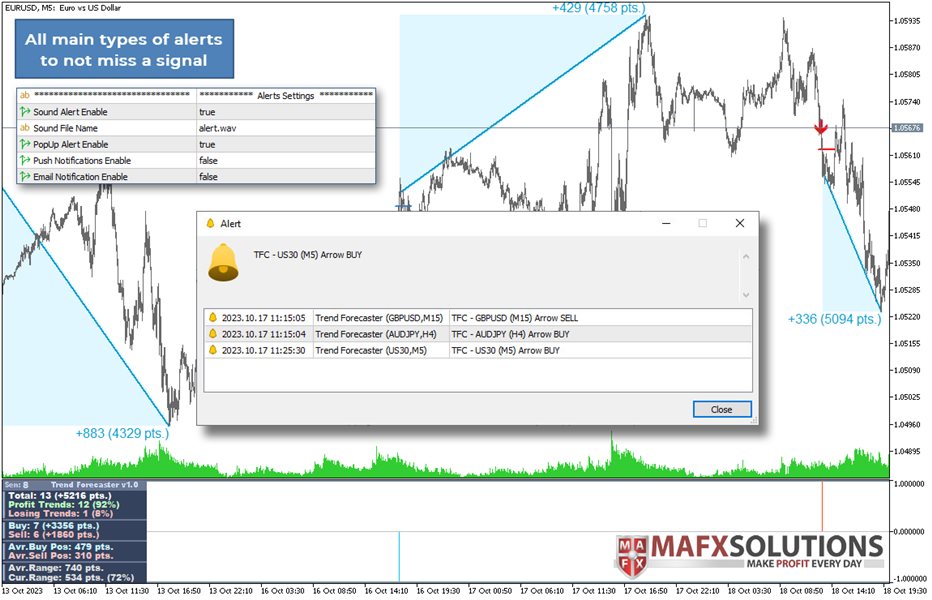
  • In practice, it's not always enough for the indicator to display the signal only on the financial instrument's chart. It's important for the trader to receive information about it, even when they are not at the monitor at that moment. In the Trend Forecaster indicator, all major types of alerts are present: sound notifications, pop-up alerts, Push notifications, and Email messages.

Please note that to receive Push-notifications and Email messages, pre-configuration of the MetaTrader 5 terminal is required (refer to the terminal's documentation)
  • The indicator is suitable for both beginners and experienced traders
  • It doesn't matter what level of experience you have. You can start your journey with the Trend Forecaster indicator if you are a beginner trader. Furthermore, you can streamline and enhance your trading performance, even if you already have another trading system, as the Trend Forecaster indicator can be used as a standalone product or as an addition to develop your own trading strategy.

  • Special Bonus for Trend Forecaster Indicator Buyers
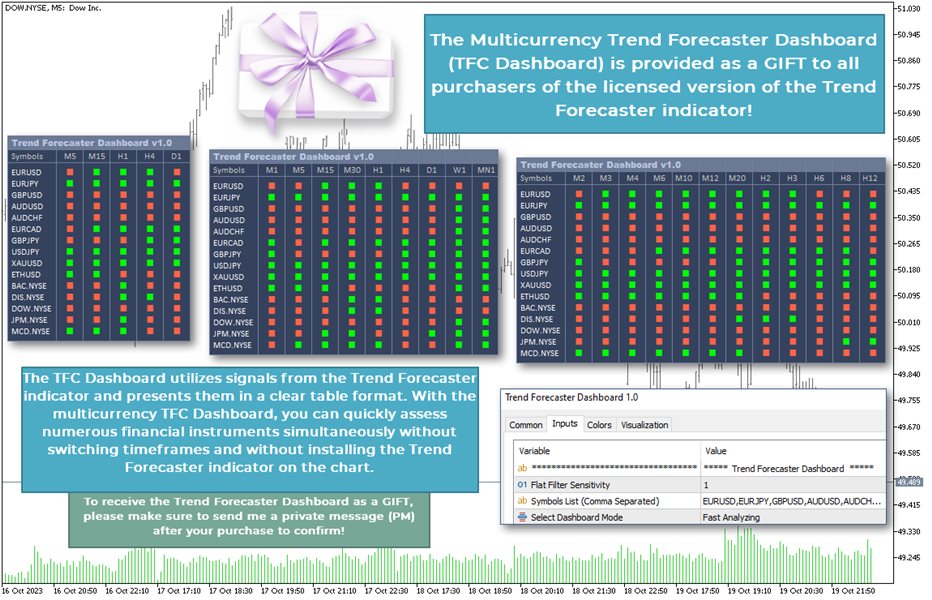
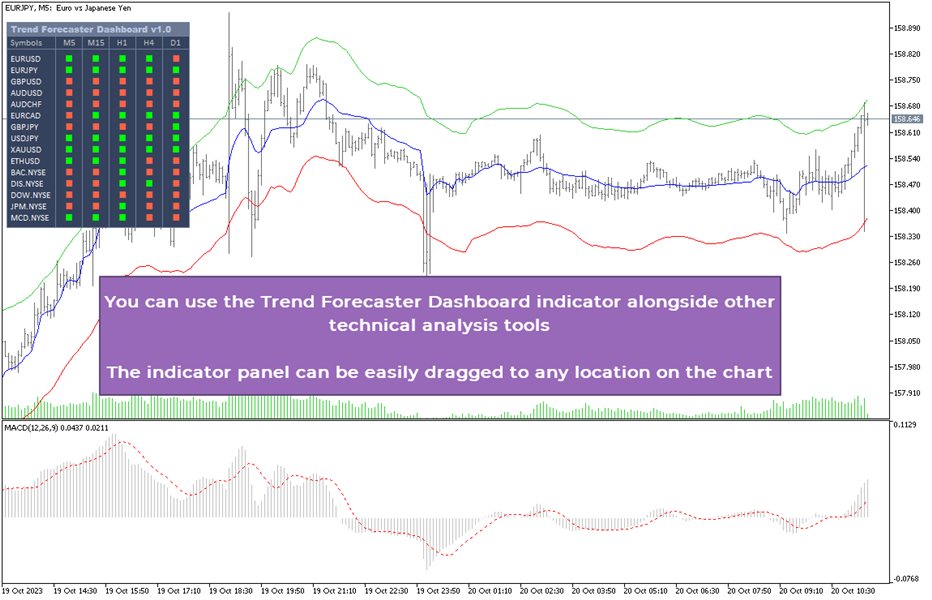
  • I want to express my gratitude to all my colleagues, friends, and buyers for their support, and as a token of my appreciation, I am offering you the Trend Forecaster Dashboard, a multi-currency panel, as a gift. By simply installing the panel on any price chart, you gain the ability to view current signals across a multitude of financial instruments and timeframes that you configure in the settings. This significantly streamlines and expedites market analysis. You can then proceed to select a specific financial instrument for more precise analysis and trade execution.

To receive the Trend Forecaster Dashboard as a gift, please make sure to send me a private message (PM) after your purchase to confirm!


Basic Functional Concepts of the Trend Forecaster Indicator

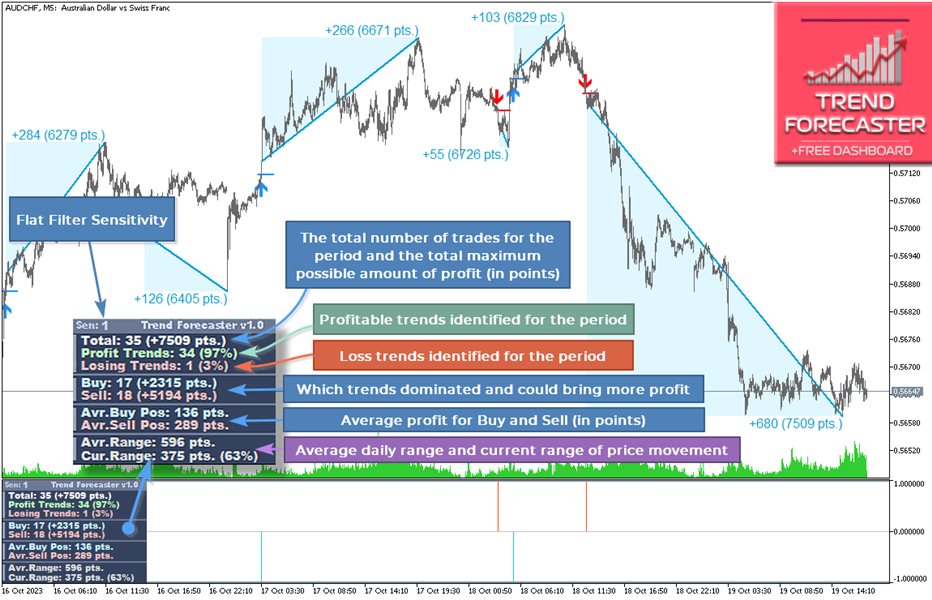
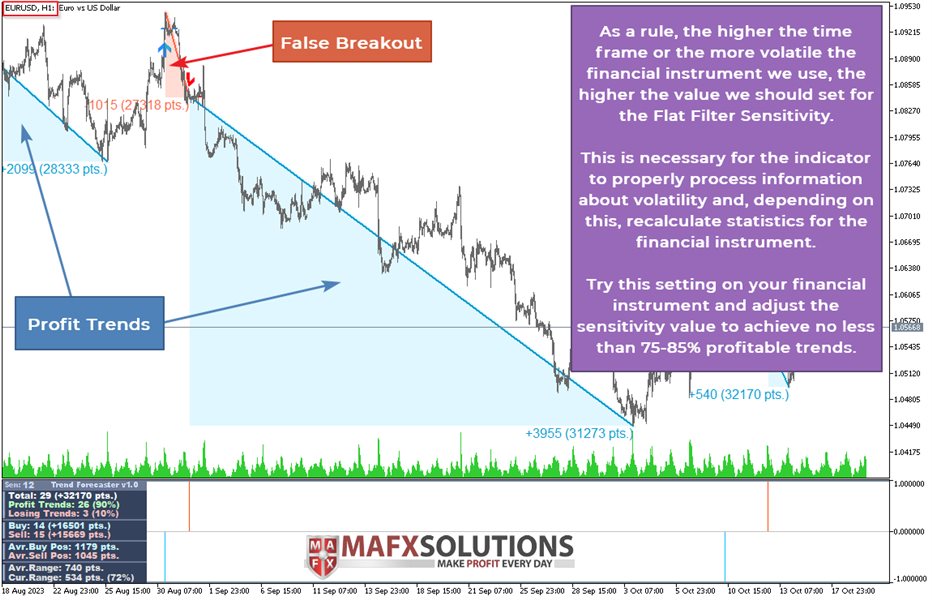
The main purpose of the indicator is to display the maximum potential profit for the current financial instrument, as well as the average profit per trade and the buying or selling advantage for the instrument. Additionally, it safeguards the trader from opening a position when the current market range for the instrument reaches the average market range, which can lead to trend exhaustion and a subsequent reversal.

As long as the current position remains open, the indicator continues to monitor price movements and updates data on the maximum potential profit in line with the price. When a counter signal appears, the indicator records the profit value and includes it in the instrument's statistics, then proceeds to monitor the new signal. Signal arrows do not repaint after appearing.


Indicator Settings

Main Settings:

Flat Filter Sensitivity The Flat Filter Sensitivity – the main indicator setting
Show Expected Profit/Loss Display of expected Profit/Loss statistics on the price chart and on the indicator panel in the subwindow of the chart. When this option is turned off, the indicator panel in the subwindow is automatically disabled
Show Info Panel Display of the indicator panel in the subwindow of the chart. When this option is turned off, financial instrument statistics are only displayed on the price chart
Panel Mode Indicator panel display mode for saving space on the chart:
Compact Mode – only the key statistics
Normal Mode – normal operating mode
Extended Mode – extended mode with full info set
Show Summary Profit at Chart Displaying the cumulative profit on a price chart
Number of Bars to Analyze The number of bars to analyze to adjust the depth of historical data analysis

Signal Settings:

Sound Alert Enable Sound signal for a buy or sell signal alert
Sound File Name The name of the sound file to be played for the sound signal (the sound file should be located in the 'Sounds' folder of the terminal)
PopUp Alert Enable Pop-up notification
Push Notifications Enable Sending a Push-notification
Email Notification Enable Sending an email message
Please note that to receive Push-notifications and Email messages, pre-configuration of the MetaTrader 5 terminal is required (refer to the terminal's documentation)

Visual Settings:

Select Color Theme Selecting a color scheme:
Off – the color scheme is disabled. In this case, custom color settings are used (as described below)
Light Theme – light theme
Dark Theme – dark theme
Buy Arrow Color The color of the 'Buy' arrow
Sell Arrow Color The color of the 'Sell' arrow
Profit Line Color The color of the line connecting the open price and the maximum profit point
Loss Line Color The color of the line for a losing position if the price does not move in the direction of the signal
Profit Line Background Color The color of the glow around the profit line for better visibility on the chart
Loss Line Background Color The color of the glow around the loss line for better visibility on the chart
Draw Profit/Loss Triangle Zones Display/hide the profit/loss zone as a triangle

Tips for Using the Trend Forecaster Indicator and the Additional Trend Forecaster Dashboard Panel

  • Opening trades when gaps occur
  • A trade entry signal occurs when a significant level is breached. I recommend avoiding trades where the level is breached on a gap.

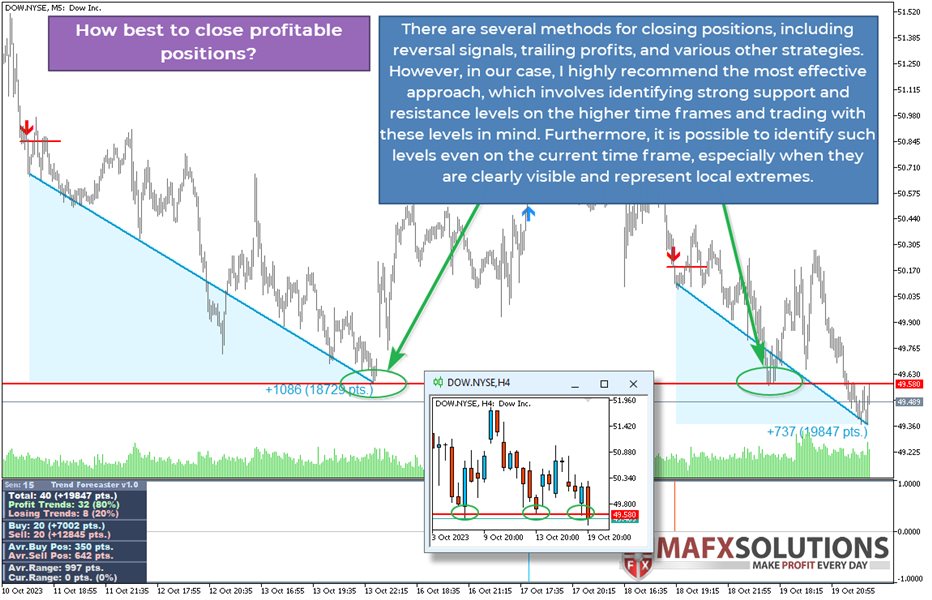
  • How best to close profitable positions?
  • The simplest and, in my opinion, not the most effective method is to close positions based on the opposite signal. However, such an approach can be quite effective in volatile financial instruments. The next method is using various types of trailing stops, such as moving the stop based on fractals. In this case, it's better to use a larger fractal size than the standard one. The most effective method, which I recommend, is to identify strong levels on the daily time frame and trade with consideration of these levels.

  • How is it best to close losing positions?
  • Along with closing positions based on the opposite signal, you can also consider the following option. If, after breaking through a level, the price doesn't continue its movement in the desired direction for a relatively long time, consolidates near the level, or retraces back below the level, you can contemplate closing positions without waiting for the opposite signal. As an example for determining a failed breakout, you can use a simplified count of bars during which the price didn't settle in the profit zone.

  • How can Average Range (Avr.Range) and Current Range (Cur.Range) help avoid a flat market with the risk of a reversal movement?
  • In trading, there is a simple truth - no one can ever accurately predict how far the price will go and when it will reverse. Fortunately, there are tools and possibilities that can significantly reduce the risk of opening positions in an exhausted market. The Average Range parameter shows us the average intraday volatility of a financial instrument. This is the value that the instrument typically moves within a day. Like all averages, it does not take into account extremely large or extremely small price movements. However, as such extreme movements are more the exception than the rule, this parameter allows us to estimate the average profit we can expect within a day on the analyzed financial instrument.

    The Current Range parameter shows us how much the price has already moved within the day. Consequently, the higher the value of the Current Range relative to the Average Range, the less profit potential remains for us. In other words, if you see that the price has already covered 80% (for example) according to the Current Range, then you have approximately 20% of the Average Range left for potential profit. It's worth giving it some thought before entering such a trade. Keep in mind that with such a small price range, there is an increased risk of the market going flat and experiencing a subsequent reversal.

  • How can Trend Forecaster Dashboard improve our results?
  • The well-known fundamental rule in trading tells us that the trend is our friend. While trading against the trend is possible, aligning your position with the trend makes the trading process significantly calmer and more effective. The additional indicator, Trend Forecaster Dashboard (TFC Dashboard), provides us with an extra advantage in our trading process. For instance, let's consider a scenario where we are trading EURUSD on an M5 time frame (which, by the way, happens to be my preferred time frame for more precise entry and exit points). Suppose we receive a Sell signal. However, we observe that the TFC Dashboard is indicating Buy signals on the H1 and H4 time frames. If we were to enter Sell positions on M5 at this point, our position would be contrary to the trend on the higher time frames, which is not favorable. To avoid this, we simply wait for a new buy signal on M5 that aligns with the trend on the higher time frames.

    Another scenario could occur where the higher time frames have reversed and are now indicating Sells. In this case, on M5, we would also wait for a Sell signal in the direction of the trends on the higher time frames. As for the signal on the Daily chart, it's good if it also confirms the direction. However, if the TFC Dashboard signals that all time frames from M5 to H4 are in the Buy zone while the Daily is in the Sell zone, in such a case, I often disregard the Daily time frame information if I'm trading on M5. I can close my Buy positions a few times before feeling the impact of the Daily time frame. However, if H1 or H4 start to turn against your direction, it's better not to take risks or use additional confirming signals and set closer profit targets.

And one more important rule that I want to share with you in this short manual:

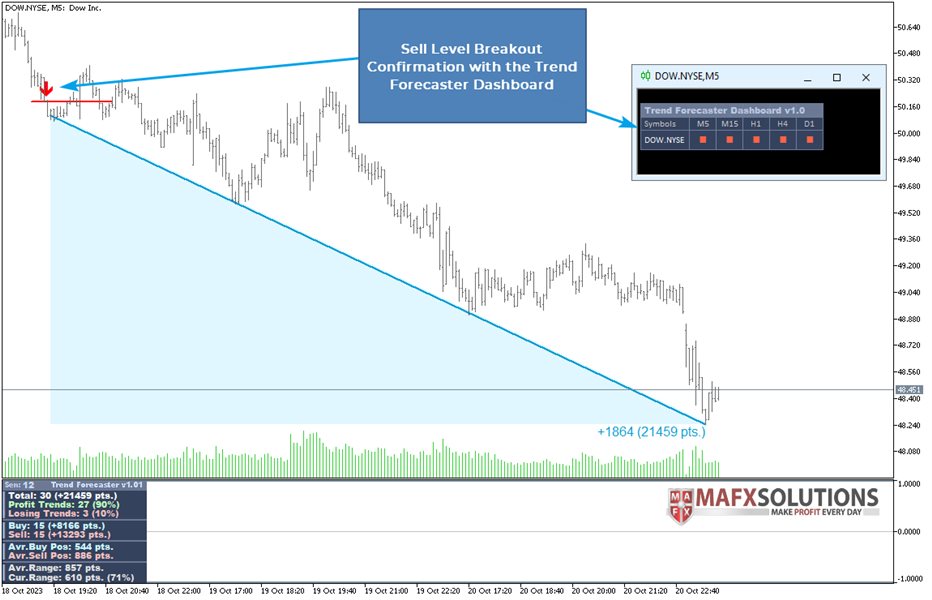
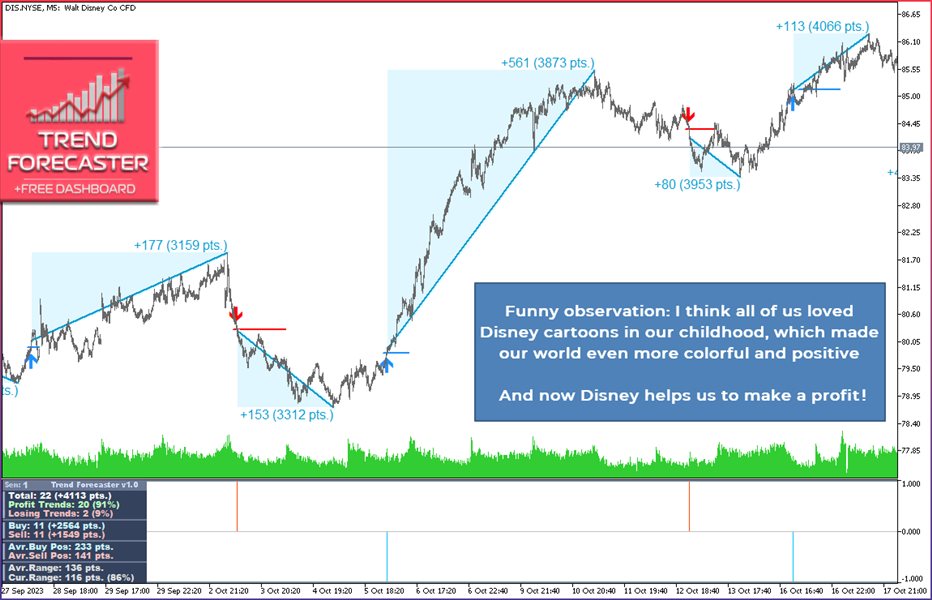
The indicator shows the maximum possible profit we can obtain from a trade, but you should understand that technically, achieving such profits pip by pip is impossible every time. Strong support and resistance levels, as mentioned earlier, can be very helpful in this regard. Additionally, use the following important rule when searching for suitable financial assets for trading. Try to select instruments for trading where the Profit Trends to Losing Trends ratio is better than 75% to 25%. In other words, anything better than that is a suitable option. For example, 96% to 4%, as I see at the time of writing this description on the charts of Disney and Dow.


You can find more detailed information on the practical application of the Trend Forecaster indicator in the indicator's manual.

Please take note! All my products can be purchased exclusively here, on the official MQL5 website. Beware of scammers and counterfeit copies of my products! When you buy licensed versions, you receive support and my trading advice along with practical guidance on using my products. And, of course, you'll get free updates for my products, which include various enhancements and additional functionality. All of this is forfeited when you acquire a questionable copy from third-party sources. I cannot be held responsible for the quality and functionality of code bought from third parties!

For all matters related to purchasing, installation, and usage of the indicator, please write in private messages (PM)!


About the reviews

Dear friends, I sincerely hope you are enjoying my developments. I would greatly appreciate it if you could share your valuable feedback on my products! As a trader and programmer, it is essential for me that my products are beneficial and assist you in trading. Your feedback directly influences future enhancements and inspires me to make my products even better for you. Thank you for your support and loyalty!

Recensioni 6
Alberto Gauer Borrego
7571
Alberto Gauer Borrego 2024.07.26 13:11 
 

Not only the indicator gives very good trend signals, but the support and attention given by the dev Alexey is also superb, thanks buddy

amnonwr2 Waskar
316
amnonwr2 Waskar 2024.07.24 20:08 
 

working very well thanks for the product

Steffen Schmidt
357
Steffen Schmidt 2024.06.21 22:05 
 

I am without doubt, this is the most superior, excellent and outstanding software indicator for MT5 for a fraction of the price the big guys are charging, it’s your chance to acquire this valuable trading software now. It’s the closest thing to Holy Grail, still within 97%-99.99% chance of succeeding.

Prodotti consigliati
Manyal trading system, CovEchoTrend Robot, focuses on reliability and flexibility. By employing statistical analysis methods to study the relationships between the base indicator and market patterns, the system enables a deeper understanding of market processes. Intelligent pattern analysis: The application of statistical data processing helps identify key trend reversal points more accurately, signaling significant market shifts. Informed decision-making is based on the intersection of indicato
The intelligent algorithm of the Godfather indicator accurately determines the trend, filters out market noise and generates entry and exit levels. The indicator will help in finding entry points when analyzing the price chart. The program first receives a "snapshot" of the graph, then analyzes it. The results are reported to the trader in the form of signals. The main purpose of this indicator is to determine the moments of entries and exits from transactions, so the indicator displays only th
Urgently mt5
Tatiana Savkevych
The Urgently indicator is designed to quickly determine the situation in the market, reflect the state of the market and signal profitable levels for opening trades. Market conditions change quickly enough, requiring constant calibration of trading strategies. Recommended for use in conjunction with any of the oscillators. The Urgently forex market trend indicator shows the trend direction and entry points. It smooths out price fluctuations when generating a signal by averaging the data and the
The Plasma Trend indicator is a simple technical indication that is used to determine the current trend direction in the market. The Plasma Trend indicator is a powerful tool for determining the direction of the trend in the Forex market. It is based on both standard technical indicators and proprietary mathematical calculations, which provides a more accurate and reliable trend determination. Its implementation in the form of lines of two colors simplifies the visual determination of a change
Ugenesys AI MT5
Odaine Ramon Mcmillan
uGenesys AI - 90% Accurate Daytrading Indicator Introducing the ultimate forex trading indicator system, uGenesys AI, powered by cutting-edge AI technology and advanced analytical techniques, including Time-Series Analysis and Genetic Algorithms. Our AI-powered trading system leverages the power of time-series analysis to identify trends and patterns in historical price data, allowing traders to make informed predictions about future market movements. By analyzing vast amounts of data, our syst
Tutti gli 11 indicatori si spengono rapidamente e si accendono rapidamente! Set di indicatori: 2 indicatori "TENDENZA"   : - veloce = linea 4 colori - lento = punti 4 colori La colorazione degli indicatori dipende dalla direzione del trend e dall'indicatore RSI: 1) trend rialzista e RSI<50% 2) trend rialzista e RSI>50% 3) RSI di tendenza al ribasso <50% 4) RSI di tendenza al ribasso   >   50% Impostare i periodi dell'indicatore per ogni fascia oraria: M5 M10 M15 M30 H1 H2 H4 H6 H12 D1 W1 MN
Hello There, Today I want to show you my new researchable fore BUY SELL indicator, it work all asset, and also work Derive Volatility asset! it work all time frame, but i recommend start 5 minute to H1 when you receive a signal just take trade and stay wait for your take profit asset All Major Pair And minor IT WORK ALSO XAUUSD Fantastic results,  for more info,,, message us thank you   
Scopri i veri schemi nascosti del mercato con il sistema di trading PREDATOR AURORA — il boss finale degli indicatori di trading ibridi. Vedi ciò che gli altri non vedono! Il sistema di trading PREDATOR AURORA è una potenza progettata per coloro che si rifiutano di nascondersi nell'ombra della mediocrità. Questo non è solo un altro indicatore; è il codice di cheat; è il tuo vantaggio sleale, un sofisticato sistema ibrido di caccia che traccia i movimenti del mercato con precisione letale in u
Trend Turn
Ivan Simonika
The implementation of the Trend Turn trend indicator is simple - in the form of lines of two colors. The indicator algorithm is based on standard indicators as well as its own mathematical calculations. The indicator will help users determine the direction of the trend. It will also become an indispensable advisor for entering the market or closing a position. This indicator is recommended for everyone, both beginners and professionals. How to interpret information from the indicator. We sell
Adjustable Consecutive Fractals  looks for 2 or more fractals in one direction and sends out a on screen alert, sound alert and push notification, for strong reversal points . Adjustable Consecutive Fractals, shows the fractals on chart along with a color changing text for buy and sell signals when one or more fractals appear on one side of price. Adjustable Consecutive Fractals is based Bill Williams Fractals . The standard Bill Williams fractals are set at a non adjustable 5 bars, BUT withe th
General Description In the simplest terms this is a contrarian intra-day scalping system. Built to try and let correct trades run as far as possible and flip the trade when indicated. The indicator looks at historical daily trading ranges to lay out levels at which it takes long and short positions based on the statistical levels. The indicator is built around index futures, mainly around S&P and the DOW but can be used an any futures contract mainly using AMP Futures to trade. The indicator is
Rocket Trend
Andriy Sydoruk
The Rocket Trend indicator is trending. The indicator draws two-color points connected by lines along the chart. This is a trend indicator, it is an algorithmic indicator. It is easy to work and understand when a blue circle appears, you need to buy, when a red one appears, sell. The indicator is used for scalping and pipsing, and has proven itself well. Rocket Trend is available for analyzing the direction of the trend for a specific period of time. Ideal for novice traders learning the laws o
Range Directional Force Indicator – Designed for You to Optimize! The Range Directional Force Indicator is a cutting-edge tool designed to empower traders by visualizing market dynamics and directional strength. Built to offer insights into market trends and reversals, this indicator is an invaluable asset for traders seeking precision in their strategies. However, it is important to note that this indicator is not optimized, leaving room for you to tailor it to your unique trading preferences.
Cycles Forecast
Pooriya Alirezaee
This indicator is based on a mathematical formula and an ANN combined, designed to make a model(using previous prices) of the most recent market condition (any chart*) in order to use the model as a forecasting tool. *This indicator can operate on any chart/timeframe, but it's suggested you use multiple timeframes for each trade because this method relies solely on the time factor, you can not use this indicator to predict price volatility, but if it's fit correctly it will show you when the nex
The new update makes this indicator a complete tool for studying, analyzing and operating probabilistic patterns. It includes: On-chart Multi-asset percentage monitor. Configurable martingales. Twenty-one pre-configured patterns, including Mhi patterns and C3. An advanced pattern editor to store up to 5 custom patterns. Backtest mode to test results with loss reports. Trend filter. Hit operational filter. Martingale Cycles option. Various types of strategies and alerts. Confluence between patter
L'indicatore Trend Speaker è uno strumento potente progettato per i trader che vogliono monitorare e analizzare facilmente le tendenze del mercato in tempo reale. Fornisce segnali di acquisto e vendita chiari e affidabili sul grafico, rendendo estremamente conveniente valutare l'attuale tendenza del mercato. Con la sua interfaccia intuitiva, Trend Speaker garantisce che non perderai mai una potenziale opportunità di trading, aiutandoti a prendere decisioni informate e migliorare la tua strategia
To download MT4 version please click here . - This is the exact conversion from TradingView: "Linear Regression Candles" By "ugurvu". - The screenshot shows similar results from tradingview and Metatrader when tested on ICMarkets on both platforms. - The overall look of the indicator is like Heiken Ashi. - It can be used as a trend confirmation indicator to detect the right trend direction. - This indicator lets you read the buffers for Candles' OHLC. - This is a non-repaint and light processing
The key logic of SignalTech is generated by Artificial Intelligence. The machine learning module should continue optimizing the core logic on the server side to guarantee that SignalTech System can accurately track the market's movement.  SignalTech can generate AI based signals with Buy/Sell Arrows and Pop-Up/Sound Alerts. Each signal has clear Entry and stop Loss levels, which should be automatically flagged on the chart, as well as potential Targets 1, 2, and 3. SignalTech can work on EURU
Eazy Indicator
Isaac Agyei Poku
Forex BUY and SELL signals from the best Heiken Ashi Smoothed indicator. Draw bullish/bearish bars on the chart. Accurate trend detector. Heiken Ashi Smoothed is a simple MT5 indicator that draws bullish and bearish bars in the chart to reflect the direction of the trend. The indicator consists of orange bearish bars and green bullish bars. When the trend changes its direction, the indicator changes its color. The indicator is a modernization of the traditional Heiken Ashi indicator. Moving Aver
We publish the indicator as a useful tool in trading and call this indicator the "Swiss Army Knife" because it provides many possibilities and combinations to help understand the material on the "Masters of Risk" trading system. The indicator itself is not part of the tools used in the "Masters of Risk" trading system. The indicator consists of 3 separate multi-timeframe indicators, which in combination with each other help to reduce the "noise" of false signals. The first of the indicators are
L'indicatore " Easy Trend Scalper MT5 " è progettato per il trading di scalping all'interno delle direzioni di tendenza. Principio di funzionamento dell'indicatore. L'indicatore determina in quale direzione si sta muovendo il mercato. Le frecce rosse grandi indicano una direzione rialzista. Frecce blu grandi: direzione ribassista. All'interno di un trend rialzista o ribassista, esiste un algoritmo per generare segnali per lo scalping sotto forma di piccole frecce. Le frecce arancioni indicano
Reliable Scalping Indicator   RELIABLE SCALPING INDICATOR ( RSI ) As the name implies, this indicator gives reliable BUY and SELL signals on your chart. NO FANCY INDICATORS, NO MESSING WITH YOUR CHARTS. IT DOES NOTHING TO YOUR CHARTS EXCEPT TO SHOW ARROWS FOR BUYS AND SELLS. It DOES NOT repaint and has alerts and notifications which you can allow. It has chart notifications, mobile and email notifications and alerts. THIS INDICATOR PRODUCES ABOUT 85% ACCURATE SIGNALS WHICH IS VERY ENOUGH TO MAKE
This indicator has a unique support and resistance calculation program, which is a unique trading system. Index characteristics Imagine if you can accurately determine the important trading support and resistance areas and points in advance, how will your trading improve? Based on a unique calculation method, the indicator analyzes the trend, analyzes the current support and resistance, and obtains the current important support resistance and single direction, the calculated stop profit and sto
True Day
Aurthur Musendame
5 (1)
True Days is a tool designed specifically for the trader who wants to catch intraday volatility in price charts.  True day makes it easier for the trader to avoid trading in the dead zone - a period in time where markets are considered dead or non volatile. The trader can concentrate on finding opportunities only during periods of profound market movements. By default the indicator gives you a true day starting at 02:00 to 19:00 hours GMT+2. You can adjust according to your Time Zone. By deafult
FREE
Scissors Pattern
Kambiz Shahriarynasab
Configure scaffolding charts and signals based on the scissor pattern, which works great at low times. Buy and sell signs based on 2 previous candle patterns It works on the active time form, and when detecting the pattern in 4 time frames, 5 minutes, 15 minutes, 30 minutes and one hour, the alert can be set to notify us of the formation of this pattern. MetaTrader version 4 click here How to use: When there is an opportunity to buy or sell, the marker places a scissors mark on the candle
Market Session Pro
Kambiz Shahriarynasab
The  Market Sessions Indicator for MT5 helps you  predict market turnarounds  by detecting major supply and demand areas. These pivot points tend to occur after a new session has started and the previous one is still open. It is also used to gauge how many points or pips the market moves on average during a session. This helps us to place better our take profits and stop losses. The indicator works on all forex pairs, gold, silver, commodities, stocks, indices and any other instrument that your
Introduction This indicator detects volume spread patterns for buy and sell opportunity. The patterns include demand and supply patterns. You might use each pattern for trading. However, these patterns are best used to detect the demand zone (=accumulation area) and supply zone (=distribution area). Demand pattern indicates generally potential buying opportunity. Supply pattern indicates generally potential selling opportunity. These are the underlying patterns rather than direct price action. T
DuhokTrend
Ismael Nayif Ismael Ismael
How to Add a Product Description (MetaTrader Market) To add the product description effectively in MetaTrader's Market, follow these steps: 1. Log into the MetaTrader Market: Go to your MQL5 account . Navigate to the "Seller's Dashboard" or "Products" section. Select your product, DuhokTrend . 2. Writing the Description: To enhance the product's rating, write a detailed and structured description : Template for Product Description: DuhokTrend - Advanced Indicator for Trend Analysis Overview:
Ultimate Retest
Nguyen Thanh Cong
5 (5)
Introduction The "Ultimate Retest" Indicator stands as the pinnacle of technical analysis made specially for support/resistance or supply/demand traders. By utilizing advanced mathematical computations, this indicator can swiftly and accurately identify the most powerful support and resistance levels where the big players are putting their huge orders and give traders a chance to enter the on the level retest with impeccable timing, thereby enhancing their decision-making and trading outcomes.
FREE
Tatino Super Signals is Non Repaint Indicator for Binary Option trading and Forex trading. Recommendations: Timeframe: All timeframes. For best results we recommend using it on M1, M5 and M15 timeframes. Currency pairs: All Pairs Account type: All Type Broker time: Any Brokers : Alls Binary Trading : Expired 1 Candle Buffer Buy=1, Sell=0, Entry Next Candle Recommended Forex trading stop loss : 15 pips Recommended  Forex tradingTake profit levels : 15 pips Specifications: Does not repaint   Pa
Gli utenti di questo prodotto hanno anche acquistato
TPSpro RFI Levels MT5
Roman Podpora
4.55 (20)
Zone di inversione / Volumi di picco / Zone attive di un attore importante =       SISTEMA TS TPSPRO ISTRUZIONI RUS       /       ISTRUZIONI       ITA       /           Versione MT4        Ogni acquirente di questo indicatore riceve inoltre GRATIS: 6 mesi di accesso ai segnali di trading dal servizio RFI SIGNALS: punti di ingresso già pronti secondo l'algoritmo TPSproSYSTEM. Materiali didattici con aggiornamenti regolari: immergiti nella strategia e accresci il tuo livello professionale. Assis
TPSproTREND PrO MT5
Roman Podpora
4.72 (18)
VERSION MT4        —        ИНСТРУКЦИЯ RUS           —        INSTRUCTIONS  ENG Caratteristiche principali: Segnale di ingresso accurato senza rendering! Una volta che il segnale appare, rimane rilevante. Questa è una differenza importante rispetto agli indicatori di ridisegno, che forniscono un segnale e poi lo modificano, con conseguente potenziale perdita dei fondi depositati. Ora puoi entrare nel mercato con maggiore probabilità e precisione. C'è anche la possibilità di colorare le candele
RelicusRoad Pro MT5
Relicus LLC
4.78 (18)
Ora $ 147 (aumentando a $ 499 dopo alcuni aggiornamenti) - account illimitati (PC o MAC) Manuale utente di RelicusRoad + Video di formazione + Accesso al gruppo Discord privato + Stato VIP UN NUOVO MODO DI GUARDARE IL MERCATO RelicusRoad è l'indicatore di trading più potente al mondo per forex, futures, criptovalute, azioni e indici, fornendo ai trader tutte le informazioni e gli strumenti di cui hanno bisogno per rimanere redditizi. Forniamo analisi tecniche e piani di trading per aiutare og
MTF Supply Demand Zones MT5
Georgios Kalomoiropoulos
5 (1)
Nuova generazione di zone di domanda e offerta automatizzate. Algoritmo nuovo e innovativo che funziona su qualsiasi grafico. Tutte le zone vengono create dinamicamente in base all'azione dei prezzi del mercato. DUE TIPI DI AVVISI --> 1) QUANDO IL PREZZO RAGGIUNGE UNA ZONA 2) QUANDO SI FORMA UNA NUOVA ZONA Non ottieni un altro indicatore inutile. Ottieni una strategia di trading completa con risultati comprovati.     Nuove caratteristiche:     Avvisi quando il prezzo raggiunge la zona di
Quantum TrendPulse
Bogdan Ion Puscasu
5 (13)
Ecco   Quantum TrendPulse   , lo strumento di trading definitivo che combina la potenza di   SuperTrend   ,   RSI   e   Stocastico   in un unico indicatore completo per massimizzare il tuo potenziale di trading. Progettato per i trader che cercano precisione ed efficienza, questo indicatore ti aiuta a identificare con sicurezza le tendenze di mercato, i cambiamenti di momentum e i punti di entrata e uscita ottimali. Caratteristiche principali: Integrazione SuperTrend:   segui facilmente l'andame
FxaccurateLS
Shiv Raj Kumawat
WHY IS OUR FXACCCURATE LS MT5 THE PROFITABLE ? PROTECT YOUR CAPITAL WITH RISK MANAGEMENT Gives entry, stop and target levels from time to time. It finds Trading opportunities by analyzing what the price is doing during established trends. POWERFUL INDICATOR FOR A RELIABLE STRATEGIES We have made these indicators with a lot of years of hard work. It is made at a very advanced level. Established trends provide dozens of trading opportunities, but most trend indicators completely ignore them! The
Top indicator for MT5   providing accurate signals to enter a trade without repainting! It can be applied to any financial assets:   forex, cryptocurrencies, metals, stocks, indices .  Watch  the video  (6:22) with an example of processing only one signal that paid off the indicator! MT4 version is here It will provide pretty accurate trading signals and tell you when it's best to open a trade and close it. Most traders improve their trading results during the first trading week with the help of
Blahtech Supply Demand MT5
Blahtech Limited
4.54 (13)
Was: $299  Now: $149  Supply Demand uses previous price action to identify potential imbalances between buyers and sellers. The key is to identify the better odds zones, not just the untouched ones. Blahtech Supply Demand indicator delivers functionality previously unavailable on any trading platform. This 4-in-1 indicator not only highlights the higher probability zones using a multi-criteria strength engine, but also combines it with multi-timeframe trend analysis, previously confirmed swings
MetaBands M5
Vahidreza Heidar Gholami
4.5 (2)
MetaBands uses powerful and unique algorithms to draw channels and detect trends so that it can provide traders with potential points for entering and exiting trades. It’s a channel indicator plus a powerful trend indicator. It includes different types of channels which can be merged to create new channels simply by using the input parameters. MetaBands uses all types of alerts to notify users about market events. Features Supports most of the channel algorithms Powerful trend detection algorith
[ MT4 Version ]  [ Order Blocks ]  [ Kill Zones ]  [ SMT Divergences ] How to trade using Order Blocks :  Click here User Interface Performance:  During testing in the strategy tester, the UI may experience lag. Rest assured, this issue is specific to the testing environment and does not affect the indicator's performance in live trading. Elevate your trading strategy with the  Order Blocks ICT Multi TF  indicator, a cutting-edge tool designed to enhance your trading decisions through advanced o
[ MT4 Version ]  [ Kill Zones ]  [ SMT Divergences ] How to trade using Order Blocks:  Click here User Interface Performance:  During testing in the strategy tester, the UI may experience lag. Rest assured, this issue is specific to the testing environment and does not affect the indicator's performance in live trading. Elevate your trading strategy with the  Order Blocks ICT Multi TF  indicator, a cutting-edge tool designed to enhance your trading decisions through advanced order block analysis
[ MT4 Version ] Are you tired of spending months on demo or live accounts to test your trading strategies? The Backtesting Simulator is the ultimate tool designed to elevate your backtesting experience to new heights. Utilizing Metatrader historical symbol information, it offers an unparalleled simulation of real market conditions. Take control of your testing speed, test ideas quickly or at a slower pace, and witness remarkable improvements in your testing performance. Forget about wasting tim
IQ Gold Gann Levels a non-repainting, precision tool designed exclusively for XAUUSD/Gold intraday trading. It uses W.D. Gann’s square root method to plot real-time support and resistance levels, helping traders spot high-probability entries with confidence and clarity. William Delbert Gann (W.D. Gann) was an exceptional market analyst, whose trading technique was based on a complex blend of mathematics, geometry, astrology, and ancient mathematics which proved to be extremely accurate. Download
AT Forex Indicator MT5
Marzena Maria Szmit
5 (5)
The AT Forex Indicator MT5 is a sophisticated trading tool designed to provide traders with a comprehensive analysis of multiple currency pairs. This powerful indicator simplifies the complex nature of the forex market, making it accessible for both novice and experienced traders. AT Forex Indicator uses advanced algorithms to detect trends, patterns and is an essential tool for traders aiming to enhance their forex trading performance. With its robust features, ease of use, and reliable signal
VolumeProfile MT5
Robert Hess
4.14 (7)
Description: The Volume Profile displays detailed informations of historical trading activities at certain price levels (Market Profile). Locate the areas with the best prices in the market and get an advantage over other market participants. Features: Customizable Market Profile Shows the "fair" Value Area with 70% of all Volume Shows critical low volume zones Shows VPOC, VAL and VAH Points integrated resource management to reduce the load while working with multiple charts Works on all timefr
The Naveen Dynamic Square  MT5  is one of the best known  technical analysis tools  inspired  by WD Gann along with the Gann Fan and Gann Box. It is considered a cornerstone of his trading technique that is based on time and price symmetry. The Naveen Dynamic Square MT5   is a powerful tool in finance for determining support and resistance levels based on a stock's extreme price points. It works by extrapolating probable price levels from a central value, typically an all-time or cyclical high o
Royal Scalping Indicator M5
Vahidreza Heidar Gholami
5 (6)
Royal Scalping Indicator is an advanced price adaptive indicator designed to generate high-quality trading signals. Built-in multi-timeframe and multi-currency capabilities make it even more powerful to have configurations based on different symbols and timeframes. This indicator is perfect for scalp trades as well as swing trades. Royal Scalping is not just an indicator, but a trading strategy itself. Features Price Adaptive Trend Detector Algorithm Multi-Timeframe and Multi-Currency Trend Low
Trade smarter, not harder: Empower your trading with Harmonacci Patterns This is arguably the most complete harmonic price formation auto-recognition indicator you can find for the MetaTrader Platform. It detects 19 different patterns, takes fibonacci projections as seriously as you do, displays the Potential Reversal Zone (PRZ) and finds suitable stop-loss and take-profit levels. [ Installation Guide | Update Guide | Troubleshooting | FAQ | All Products ] It detects 19 different harmonic pri
Advanced Supply Demand MT5
Bernhard Schweigert
4.5 (14)
La migliore soluzione per qualsiasi principiante o trader esperto! Questo indicatore è uno strumento di trading unico, di alta qualità e conveniente perché abbiamo incorporato una serie di funzionalità proprietarie e una nuova formula. Con questo aggiornamento, sarai in grado di mostrare fusi orari doppi. Non solo potrai mostrare una TF più alta, ma anche entrambe, la TF del grafico, PIÙ la TF più alta: SHOWING NESTED ZONES. Tutti i trader di domanda di offerta lo adoreranno. :) Informazioni imp
KT Candlestick Patterns MT5
KEENBASE SOFTWARE SOLUTIONS
KT Candlestick Patterns identifica e segna in tempo reale i 24 pattern di candele giapponesi più affidabili. I trader giapponesi utilizzano queste formazioni sin dal XVIII secolo per prevedere la direzione del prezzo. Non tutti i pattern sono ugualmente affidabili, ma se combinati con supporti e resistenze offrono un quadro più chiaro e preciso del mercato. L'indicatore include molti pattern trattati nel libro di Steve Nison: "Tecniche dei grafici a candele giapponesi". Inoltre, rileva anche p
CBT Quantum Maverick Sistema di Trading Binario ad Alta Efficienza CBT Quantum Maverick è un sistema di trading binario ad alte prestazioni progettato per trader che cercano precisione, semplicità e disciplina. Non è necessaria alcuna personalizzazione: il sistema è ottimizzato per fornire risultati efficaci fin dall'inizio. Con un po' di pratica, i segnali possono essere facilmente compresi. Caratteristiche principali: Precisione dei Segnali: Segnali di trading basati sulla candela attuale,
MetaForecast M5
Vahidreza Heidar Gholami
5 (3)
MetaForecast predice e visualizza il futuro di qualsiasi mercato basandosi sull'armonia dei dati dei prezzi. Sebbene il mercato non sia sempre prevedibile, se esiste un modello nei prezzi, MetaForecast può prevedere il futuro con la massima precisione possibile. Rispetto ad altri prodotti simili, MetaForecast può generare risultati più accurati analizzando le tendenze di mercato. Parametri di input Past size (Dimensione passata) Specifica il numero di barre che MetaForecast utilizza per creare
L'Oscillatore dell'Indice di Precisione (Pi-Osc) di Roger Medcalf di Precision Trading Systems La Versione 2 è stata attentamente rielaborata per essere estremamente veloce nel caricarsi sul tuo grafico e sono state apportate alcune altre migliorie tecniche per migliorare l'esperienza. Il Pi-Osc è stato creato per fornire segnali di sincronizzazione del trading accurati progettati per individuare punti di esaurimento estremi, i punti ai quali i mercati vengono costretti a recarsi solo per eli
PZ Mean Reversion MT5
PZ TRADING SLU
3 (2)
Indicatore unico che implementa un approccio professionale e quantitativo al trading di reversione. Sfrutta il fatto che il prezzo devia e ritorna alla media in modo prevedibile e misurabile, il che consente regole di entrata e uscita chiare che superano di gran lunga le strategie di trading non quantitative. [ Installation Guide | Update Guide | Troubleshooting | FAQ | All Products ] Segnali di trading chiari Incredibilmente facile da scambiare Colori e dimensioni personalizzabili Implementa l
The   Time_Price_SQ9_Degree   indicator is based on the 9 Gann square. Using this indicator, you can identify strong time and price zones. The indicator displays the levels as a degree value. The degrees can be set in the settings. After launching, the MENU button appears. If it is highlighted, it can be moved to any point on the graph, and after double-clicking on it, it stops being highlighted and menu buttons appear. To hide the menu, just double-click on the button, it will become highlight
Volume by Price MT5
Brian Collard
3.25 (4)
Volume Profile, Footprint and Market Profile TPO (Time Price Opportunity). Volume and TPO histogram bar and line charts. Volume Footprint charts. TPO letter and block marker collapsed and split structure charts. Static, dynamic and flexible range segmentation and compositing methods with relative and absolute visualizations. Session hours filtering and segment concatenation with Market Watch and custom user specifications. Graphical layering, positioning and styling options to suit the user's a
DESCRIZIONE ICSM (Impulse-Correction SCOB Mapper) è l'indicatore che analizza il movimento dei prezzi e identifica impulsi validi, correzioni e SCOB (Single Candle Order Block). È uno strumento potente che può essere utilizzato con qualsiasi tipo di analisi tecnica perché è flessibile, informativo, facile da usare e migliora sostanzialmente la consapevolezza del trader delle zone di interesse più liquide. IMPOSTAZIONI Generale | Visivi Tema colore — definisce il tema colore dell'ICSM. SCOB
Was: $249  Now: $149   Market Profile defines a number of day types that can help the trader to determine market behaviour. A key feature is the Value Area, representing the range of price action where 70% of trading took place. Understanding the Value Area can give traders valuable insight into market direction and establish the higher odds trade. It is an excellent addition to any system you may be using. Inspired by Jim Dalton’s book “Mind Over Markets”, this indicator is designed to suit the
Berma Bands
Muhammad Elbermawi
5 (3)
L'indicatore Berma Bands (BBs) è uno strumento prezioso per i trader che cercano di identificare e capitalizzare i trend di mercato. Analizzando la relazione tra il prezzo e le BBs, i trader possono discernere se un mercato è in una fase di trend o di range. Visita il [ Berma Home Blog ] per saperne di più. Le Berma Bands sono composte da tre linee distinte: la Upper Berma Band, la Middle Berma Band e la Lower Berma Band. Queste linee sono tracciate attorno al prezzo, creando una rappresentazion
TPA True Price Action indicator reveals the true price action of the market makers through 100% non-repainting signals strictly at the close of a candle! TPA shows entries and re-entries, every time the bulls are definitely stronger than the bears and vice versa. Not to confuse with red/green candles. The shift of power gets confirmed at the earliest stage and is ONE exit strategy of several. There are available now two free parts of the TPA User Guide for our customers. The first "The Basics"
Altri dall’autore
Scalper Inside PRO
Alexey Minkov
4.76 (63)
!SPECIAL SALE! An exclusive indicator that utilizes an innovative algorithm to swiftly and accurately determine the market trend. The indicator automatically calculates opening, closing, and profit levels, providing detailed trading statistics. With these features, you can choose the most appropriate trading instrument for the current market conditions. Additionally, you can easily integrate your own arrow indicators into Scalper Inside Pro to quickly evaluate their statistics and profitability
Reversal Master
Alexey Minkov
4.92 (13)
!SPECIAL SALE! The Reversal Master is an indicator for determining the current direction of price movement and reversal points. The indicator will be useful for those who want to see the current market situation better. The indicator can be used as an add-on for ready-made trading systems, or as an independent tool, or to develop your own trading systems. The Reversal Master indicator, to determine the reversal points,  analyzes a lot of conditions since the combined analysis gives a more accura
All in One Trade
Alexey Minkov
4.48 (27)
!SPECIAL SALE!  The All-in-One Trade Indicator (AOTI) determines daily targets for EURUSD, EURJPY, GBPUSD, USDCHF, EURGBP, EURCAD, EURAUD, AUDJPY, GBPAUD, GBPCAD, GBPCHF, GBPJPY, AUDUSD, and USDJPY. All other modules work with any trading instruments. The indicator includes various features, such as Double Channel trend direction, Price channel, MA Bands, Fibo levels, Climax Bar detection, and others. The AOTI indicator is based on several trading strategies, and created to simplify market analy
Color Trend FX
Alexey Minkov
4 (4)
!SPECIAL SALE!  The indicator shows on the chart the accurate market entry points, accurate exit points, maximum possible profit of a deal (for those who take profit according to their own system for exiting deals), points for trailing the open positions, as well as detailed statistics. Statistics allows to choose the most profitable trading instruments, and also to determine the potential profits. The indicator does not redraw its signals! The indicator is simple to set up and manage, and is su
Filtro:
Alberto Gauer Borrego
7571
Alberto Gauer Borrego 2024.07.26 13:11 
 

Not only the indicator gives very good trend signals, but the support and attention given by the dev Alexey is also superb, thanks buddy

amnonwr2 Waskar
316
amnonwr2 Waskar 2024.07.24 20:08 
 

working very well thanks for the product

Steffen Schmidt
357
Steffen Schmidt 2024.06.21 22:05 
 

I am without doubt, this is the most superior, excellent and outstanding software indicator for MT5 for a fraction of the price the big guys are charging, it’s your chance to acquire this valuable trading software now. It’s the closest thing to Holy Grail, still within 97%-99.99% chance of succeeding.

Wolfgang Rockert
2344
Wolfgang Rockert 2023.12.26 12:53 
 

The indicator provides good results, but you should stick to the rules that the author has posted as examples...

Harakty
406
Harakty 2023.12.10 02:05 
 

Another excellent product by Alexey. I integrated the Trend Forecaster with my SCM/ITC strategies and it works very well. Perhaps S/D/ FVG and other SMC features could be part of future versions!

Marcos Yuge
659
Marcos Yuge 2023.11.15 09:54 
 

In my daily analyzes I always use tools that help with decision making. And from time to time, I always look for other products that can further improve my strategy. I saw that the author had developed TREND FORECASTER and in the description I realized that it would fit into my strategies. I contacted the author and in his response I was really convinced that it was important to have this tool. In my first analysis using TREND FORECASTER I was impressed with the results. Easily answer 3 questions that greatly increase the chance of success: Does the market have room to move at the moment I am evaluating the asset? What is the predominant trend? What are my chances of success if I choose to trade this asset? Therefore, in my humble opinion, it was well worth the investment. It wasn't a blind purchase, because I already knew the author's work. I purchased the other 4 products he created and each of them, by using a different algorithm from the other, always made decision making easier. Because only when the tools show convergence with my strategy do I open trade. In other words, I have proven in practice that the tools he creates are really worth the investment. Was TREND FORECASTER worth buying? Absolutely. Finally, a few words about the author. Very accessible to answer questions. It doesn't try to sell you the product at any cost. There is a lot of material he presents to help you understand how each tool works. I learned a lot about market analysis with this material. Conclusion: The author provides an excellent product, with exceptional after-sales service. If you are unsure whether this is the right product for you, I recommend that you contact the author. Tell us what you expect from the product and it will guide you as to whether the tool is suitable for your trading style. Whatever the answer, he will always be honest.

Alexey Minkov
12679
Risposta dello sviluppatore Alexey Minkov 2023.11.17 12:00
Thank you for such a detailed and pleasant review of my products and about me. ❤️ Your support is very important to me because it shows that I am moving in the right direction and creating products that are beneficial to my friends and customers. There is still much more exciting ahead, as I always have many ideas. Good luck to you in your business!
Rispondi alla recensione
Versione 2.3 2024.12.23
▪ Fixes for improved compatibility with the latest terminal builds
Versione 2.2 2024.06.02
▪ Added a new feature for more fine-tuning of the indicator - details will be in the manual

▪ Other improvements in the code
Versione 2.1 2024.01.28
▪ Fixed an issue with the probability of premature calculations in the process of launching and updating the terminal

▪ Improved optimization of interaction between Trend Forecaster and Trend Forecaster Dashboard

▪ Other improvements in the code
Versione 2.0 2023.11.11
▪ Improved interaction between Trend Forecaster and Trend Forecaster Dashboard

▪ Added color hint of global trend on higher time frames in the HTF-Mode of the TFC Dashboard

▪ Optimization of internal algorithms

▪ Other improvements in the code
Versione 1.12 2023.10.25
▪ The ability to use the Trend Forecaster Dashboard as an MTF (Multiple Time Frame) filter for the current financial instrument has been added

▪ Other improvements in the code
Versione 1.1 2023.10.22
▪ Minor fixes to the code