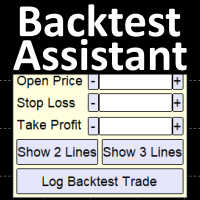
Backtest Assistant x IoTraders
- Utilità
- Dennis Christian
- Versione: 1.50
- Aggiornato: 22 ottobre 2024
- Attivazioni: 5
Simplify backtesting by automatically calculate trade outcomes (Profit or Loss) and estimated swap cost based on user-provided open, stop loss, and take profit prices, while also write the data into CSV file and capture before-and-after chart pictures automatically
$30 for the next 25 downloaders, next price: $45
Try Free Trial Version Here: Download Free Trial
Features:
Data Logging: Log all backtest data into a .CSV file (Open time, Close time, Open, SL, TP, Risk Reward Ratio, profit pips, swap cost, etc.)
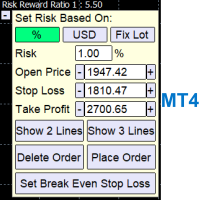
Trade Result Calculation: Determine the outcome of a trade based on the open, stop loss, and take profit prices input
Trade Result Tie Breaker: Determine the outcome when a single candle touches both the Take Profit and Stop Loss prices by automatically examining the lower timeframe
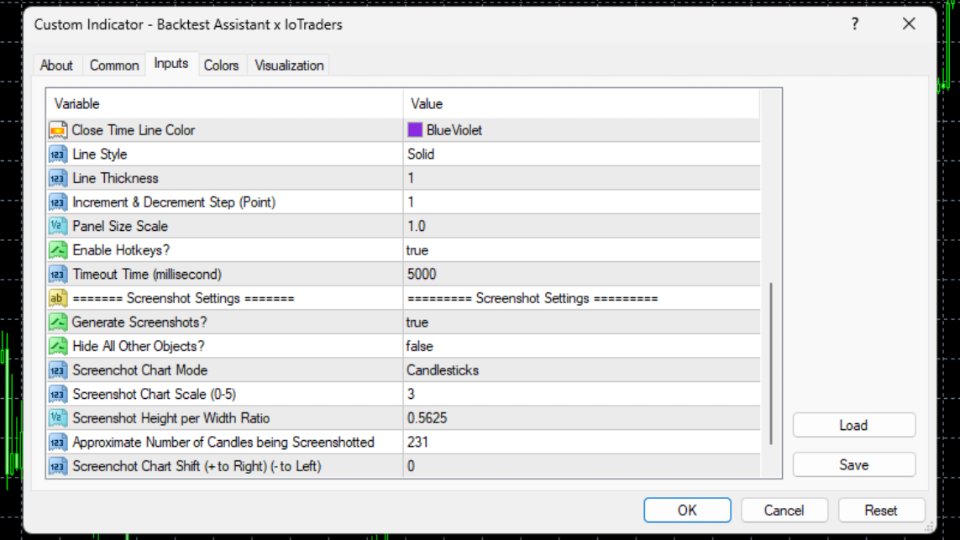
Backtest Result Chart Screenshot: Capture opening chart and closing chart of each backtested trade data
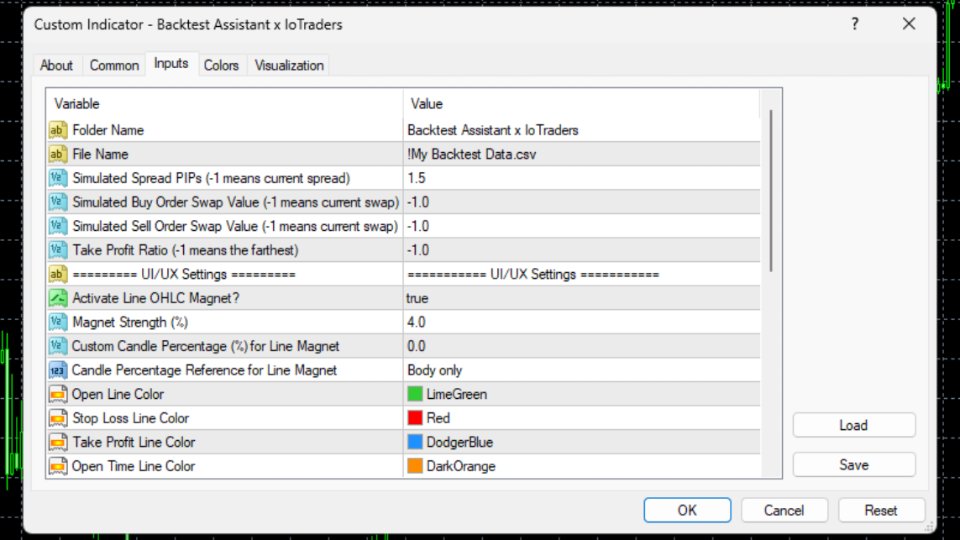
Hide Background Objects: Objects on chart will not be shown in the chart screenshot (can be turned off in the "Inputs" section)
Swap Calculator: Estimate the swap cost (or gain) of the backtested trade (positive value means swap profit, and negative value means swap loss)
Risk-Reward Take Profit (optional): Set the Take Profit Price based on Risk-Reward Ratio by inserting the ratio number followed by 'r' in the Take Profit input, or predetermine the ratio in the "Inputs" section
Farthest Take Profit Finder (optional): Find the farthest possible Take Profit Price based on Open Time, Open Price, and Stop Loss Price provided just in case You are unsure where to put the Take Profit Price
Comment: Set a specific comment for each backtested trade
Line Function: Set Open, Stop Loss, and Take Profit Prices easily by dragging Horizontal Lines to the desired prices or candle structures (You can type them manually too if needed)
OHLC Line Magnet: Make the Horizontal Lines attracted toward the Open, High, Low, or Close Price of the nearest candle to increase precision (can be turned off in the Inputs section)
Custom Line Magnet: Make the Horizontal Lines attracted toward a specific percentage of the nearest candle (customizable in the Inputs section)
Hotkeys: Execute functions by pressing keyboard keys to increase productivity and reduce mouse dragging time (can be turned off in the Inputs section)
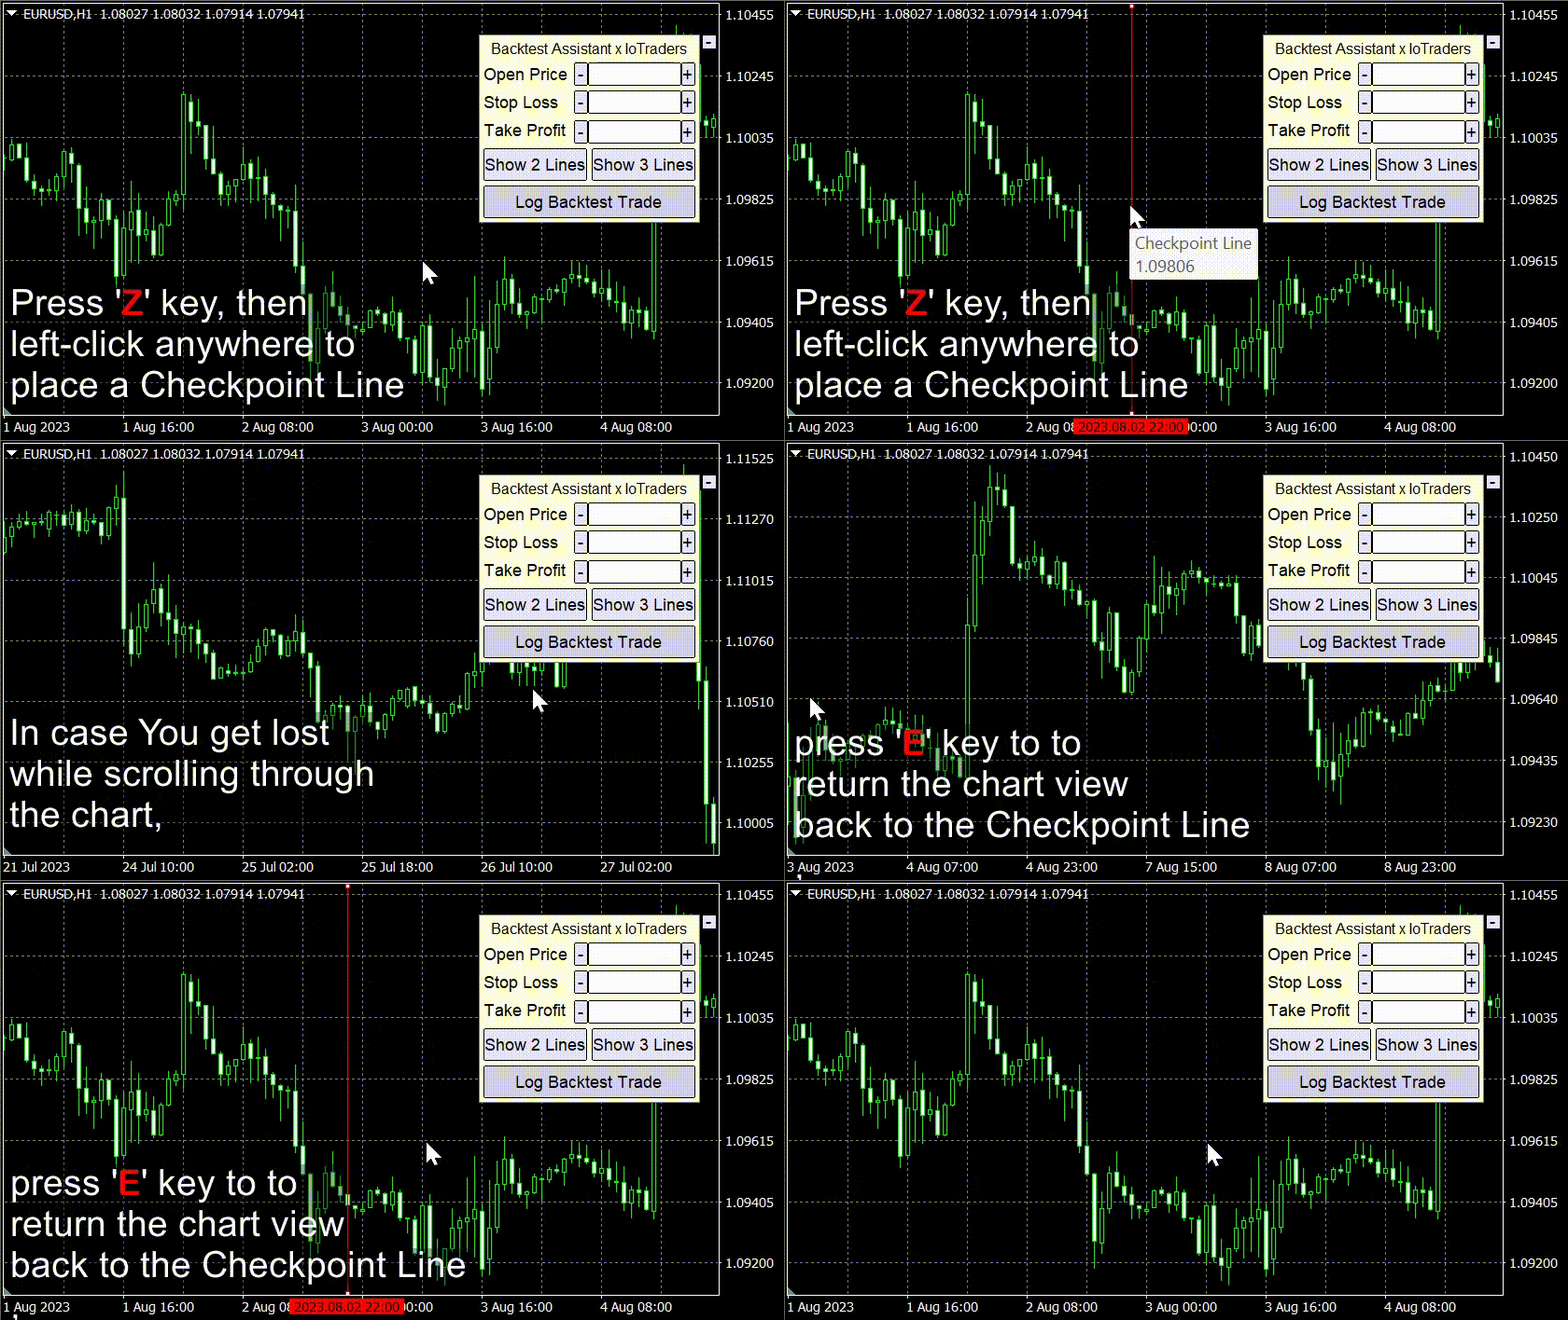
(F=Show 3 Lines, D=Show 2 Lines, R=Log Trade Data, Z=Place/Delete Checkpoint Line, E=Shift the Chart towards the Checkpoint Line)
Checkpoint Line: Place a Checkpoint Line anywhere on the chart by hitting 'Z' key and then left-clicking a candle. Then, hit "E" key to return the chart view back to the Checkpoint Line whenever you get lost while scrolling through the chart
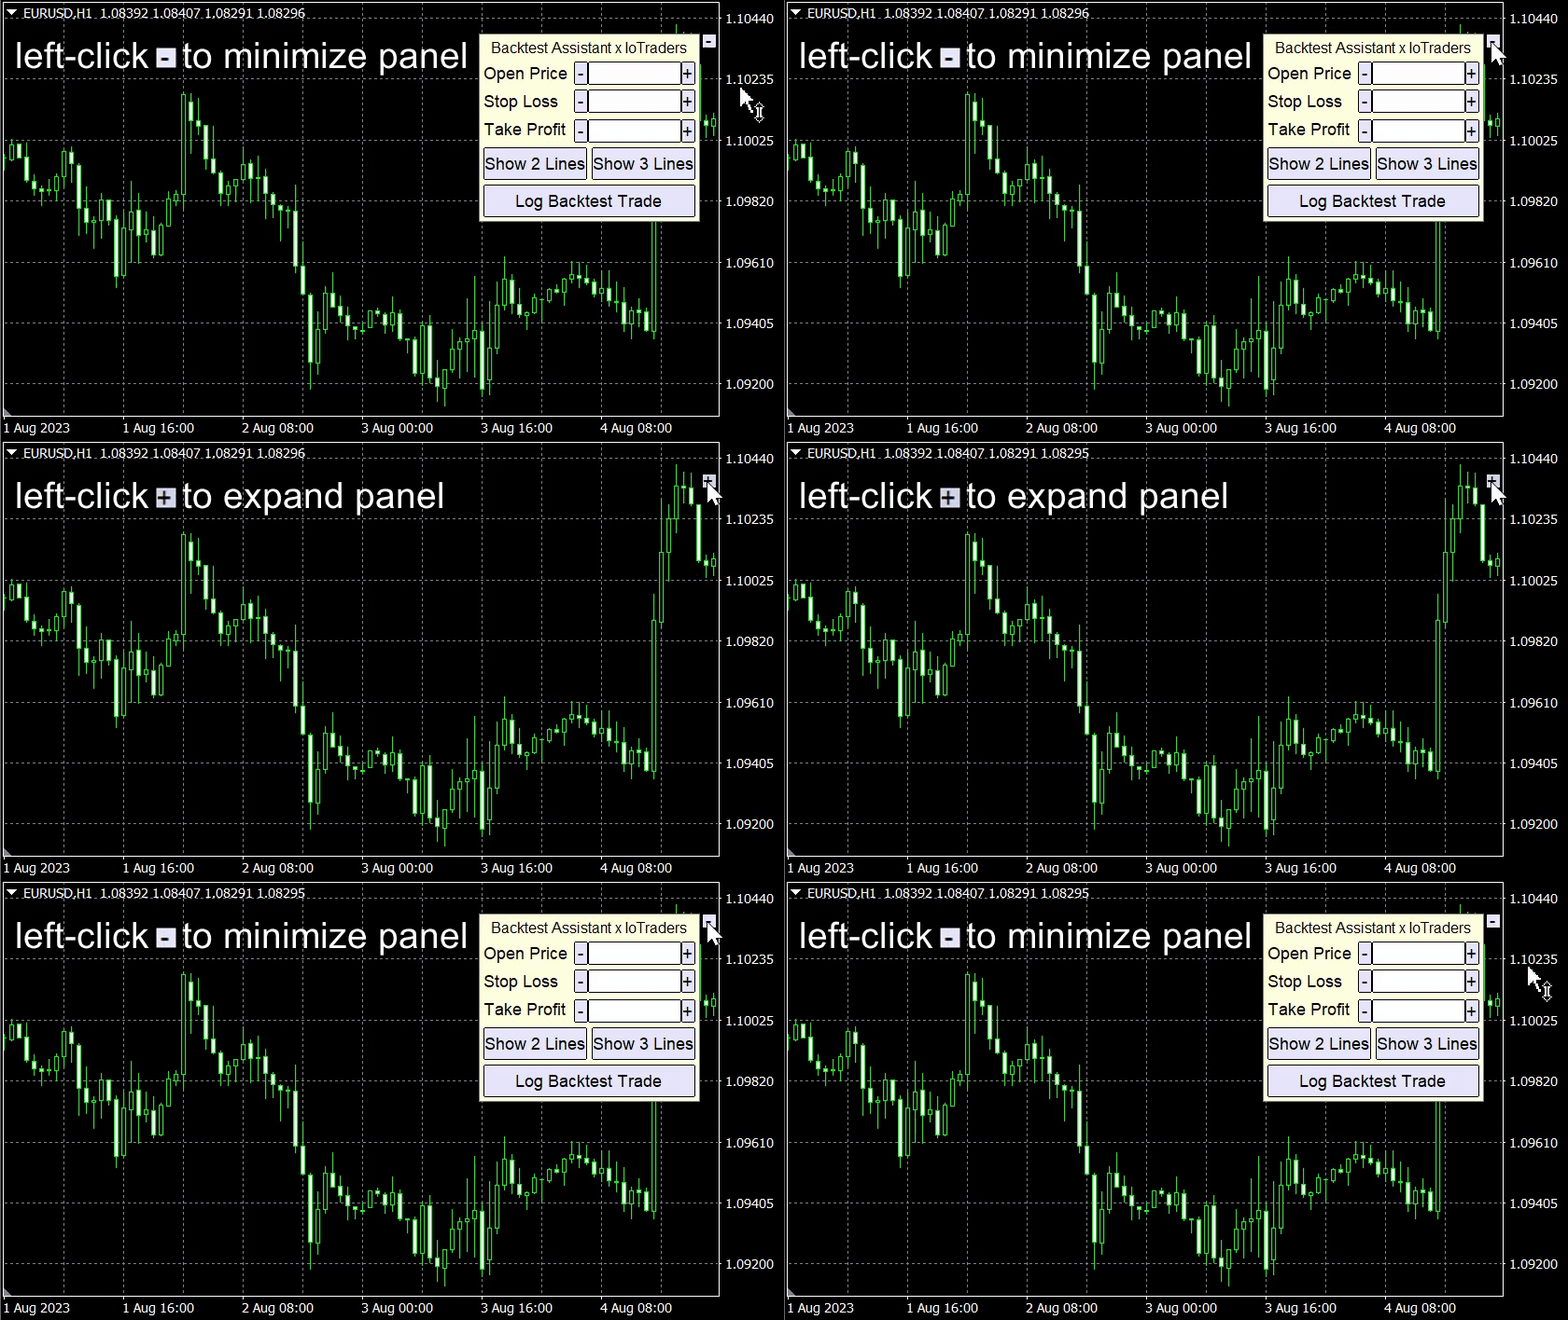
Adjustable Panel Size: Adjust Panel Size Scale via inputs section to easily fit your preferred display. There is minimize & maximize button too for you to see the covered part of the chart easily
Note: Make sure the CSV file is closed when logging data
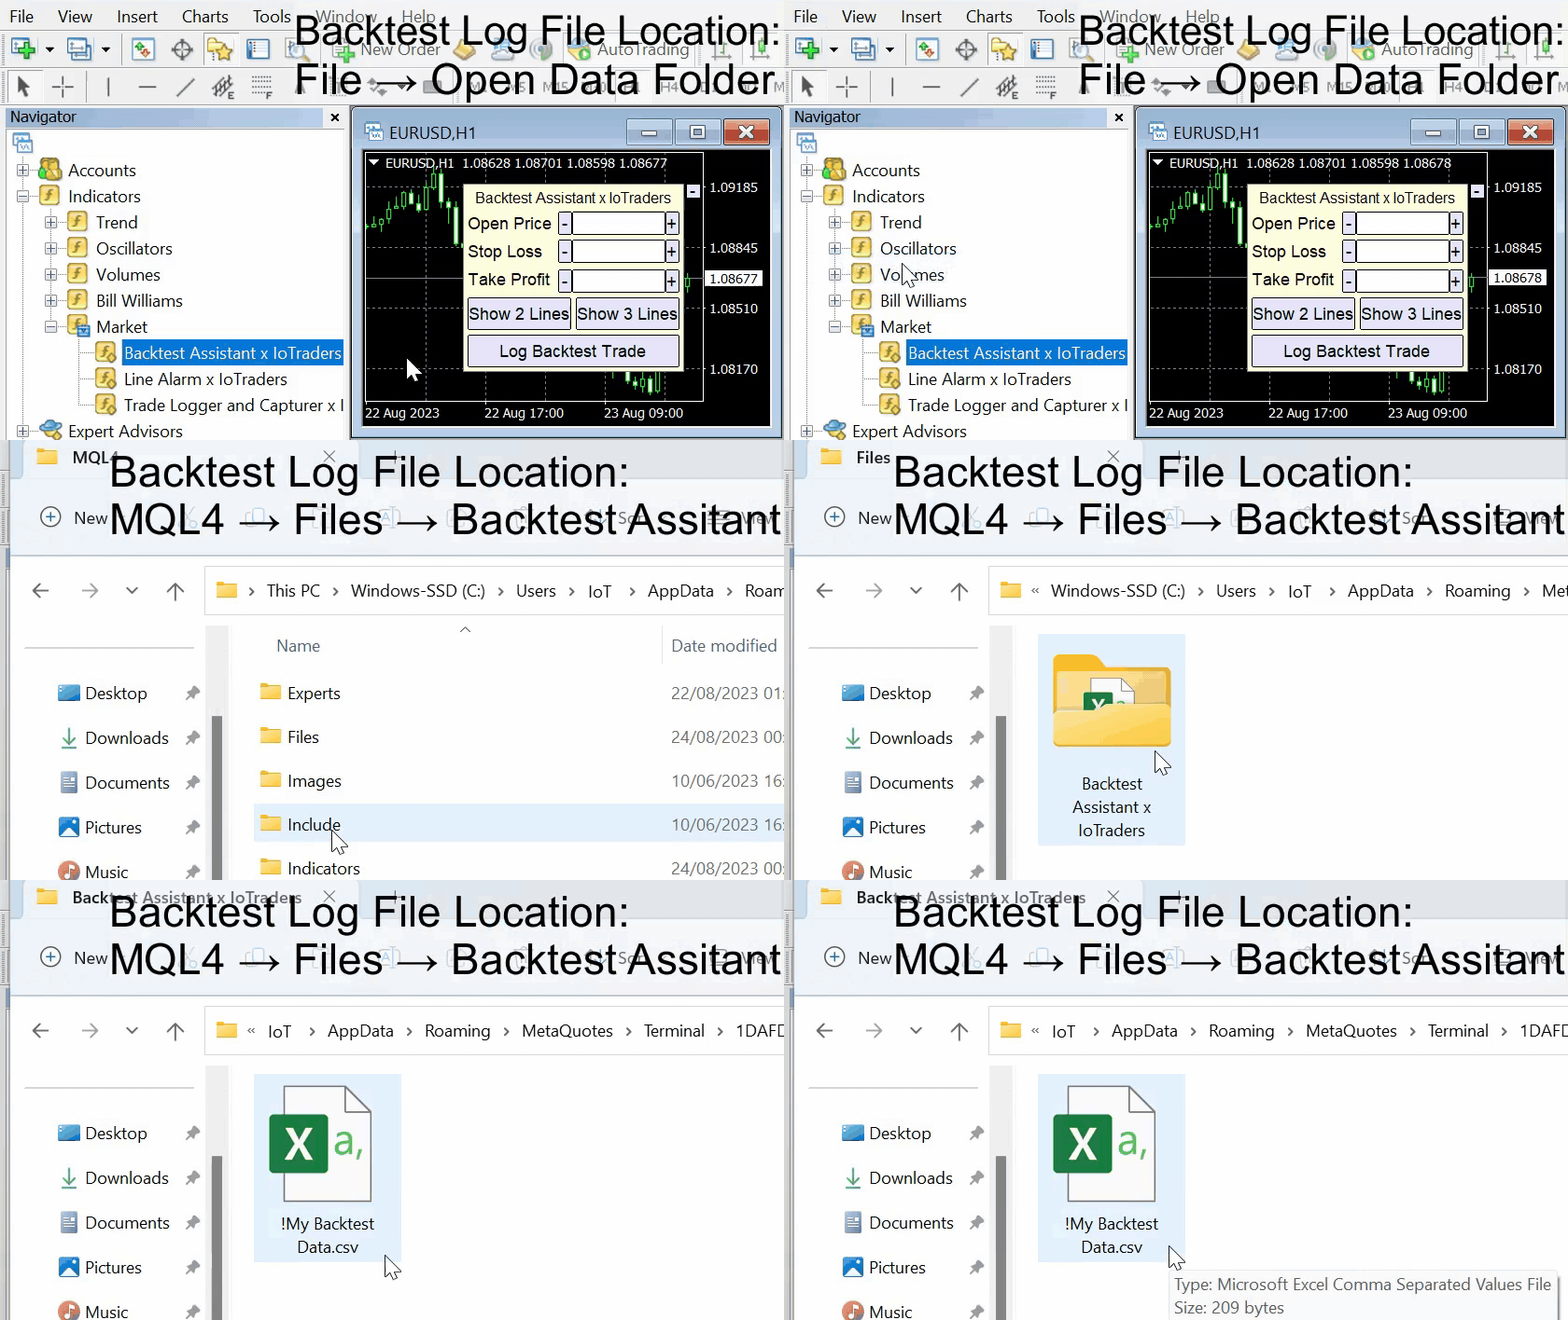
How to Find the logged data and screenshots?
For more Details, Watch the Tutorial Video below!
Disclaimer:
- Any loss involving this trading tool is the sole responsibility of the User, and not the responsibility of the Creator of this trading tool.
- The backtest data can only be written when the .CSV file is closed.
- The precision of open and close times is determined by the chart timeframe. For example, in a 1-hour chart, the times will only be written with hour-level precision.
- The displayed swap cost in the data is just an approximation and could potentially differ from the actual value.
