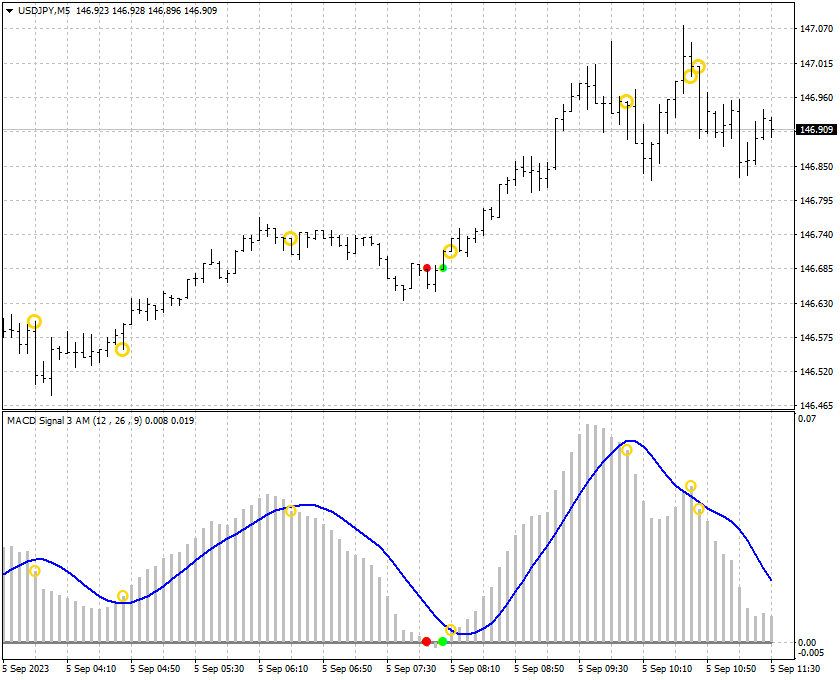
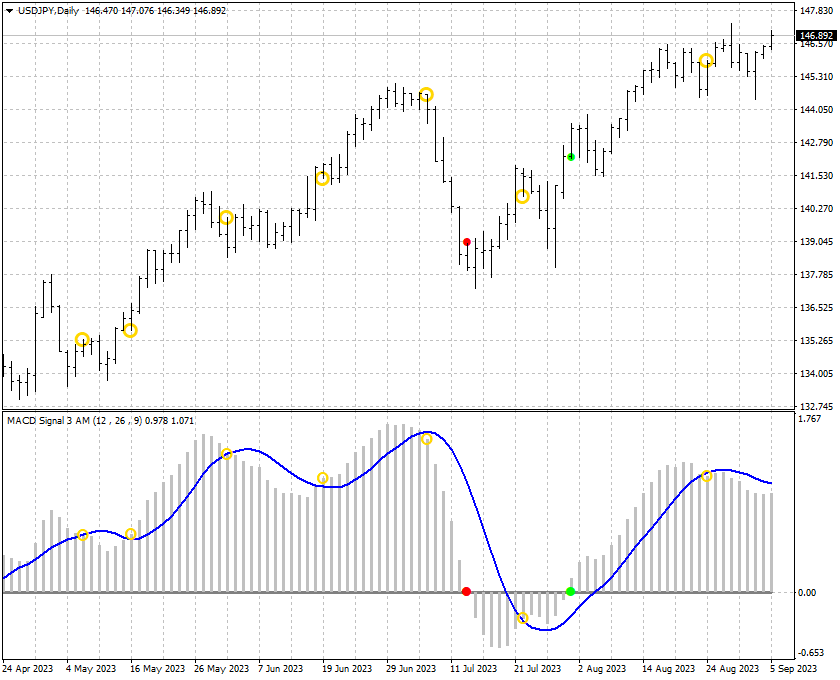
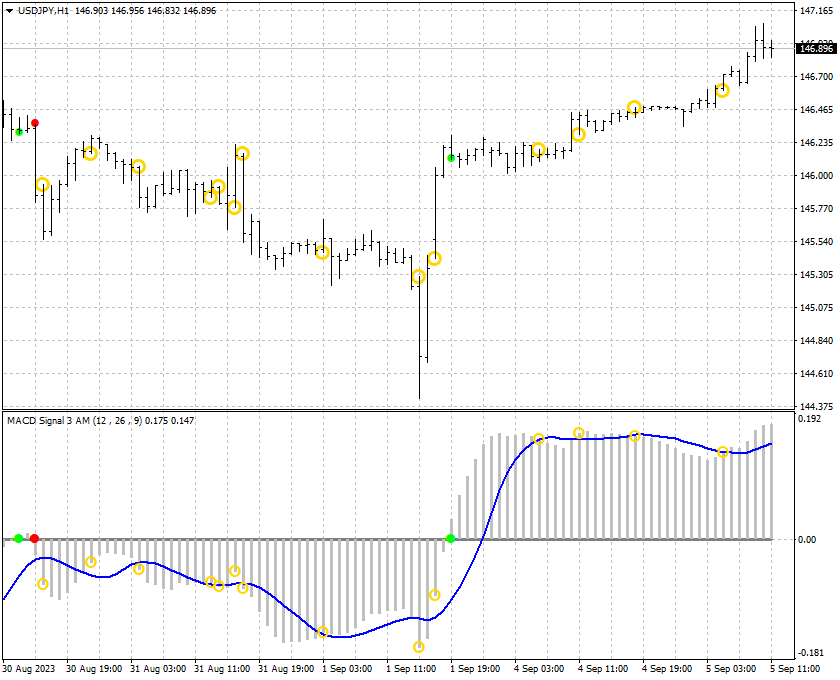
• Panoramica
  • Recensioni
  • Commenti
  • Novità

MACD Signal 3 AM

This indicator displays signals about the standard MACD crossing the zero value, as well as about crossing the signal line.

The indicator does not redraw.

Signals are shown on fully formed candles.

The indicator can send notifications of its signals to the terminal and email.

Custom Parameters:

  • Fast_EMA_Period - fast moving average period; 
  • Slow_EMA_Period - slow moving average period; 
  • Signal_Period - signal line period; 
  • MACD_Price - the price at which the indicator is built;

  • Alerts - show a dialog box;
  • Send_Mail - sends an email using an address specified on the Email tab of the options window;
  • Send_Notification - sends push notifications to the mobile terminals, whose MetaQuotes IDs are specified in the "Notifications" tab.


Prodotti consigliati
The indicator detects and displays Shark harmonic pattern (see the screenshot). The pattern is plotted by the extreme values of the ZigZag indicator (included in the resources, no need to install). After detecting the pattern, the indicator notifies of that by a pop-up window, a mobile notification and an email. The indicator highlights the process of the pattern formation and not just the complete pattern. In the former case, it is displayed in the contour triangles. After the pattern is comple
This is a combination of multiple oscillators into a single divergence system that creates the impression of a more reliable divergence indicator. It is multi-currency based and works best on 15 minutes timeframe and above. Every time a signal is generated, it shows an alert to the user. It is more ideal if combined with other price action indicators or trading systems.
This indicator is the undisputed leader among the indicators. And for this statement there is a good reason. The indicator builds a very high quality channel in which it generates signals to enter! What is the ideal strategy for the trader, since the trader always hesitates when choosing a strategy for the job. That is, this indicator will allow you to solve the dilemma of choosing a job by trend or to the channel, since it combines these two basic concepts. Working with the indicator is very
FXC iDeM-DivergencE MT4 Indicator This is an advanced DeMarker indicator that finds trend-turn divergences on the current symbol. The indicator detects divergence between the DeMarker and the price movements as a strong trend-turn pattern. Main features: Advanced divergence settings Price based on Close, Open or High/Low prices Give Buy/Sell open signals PUSH notifications E-mail sending Pop-up alert Customizeable Information panel Input parameters: DeM Period: The Period size of the DeMarke
Voles Indicator Operation Principles It is based on the standard indicators of the MetaTrader 4 terminal. It shows the market entry points. How to trade When a bar is complete and an arrow is shown, place a BuyStop order at the High of the bar is the arrow is green, or a SellStop order at the Low of the bar if the arrow is red. StopLoss should be set at the level of the last downwards fractal below the entry point at a green arrow or at the level of the last upwards fractal above the entry po
Forex Indicator "MACD with Trend ZigZag" for MT4 MACD   indicator itself is one of the most popular tool for trend trading "MACD with Trend ZigZag" is excellent for using   with Price Action entries or in combination with other indicators Use this indicator to select most accurate entry signals: - If MACD is above 0 (green color) and ZigZag line is upward - search only for Buy Price Action patterns -  If MACD is below 0 (pink color) and ZigZag line is downward - search only for Sell Price Action
Wave Wolf MT4
Andrei Salanevich
L'indicatore Forex Wave wold MT4 è progettato per cercare le onde di Woolf e visualizzarle nella finestra corrente del terminale di trading. Un ottimo indicatore per i trader che utilizzano le onde di Wolfe nel trading. La sua applicazione nelle strategie di trading aumenterà notevolmente la loro efficienza e redditività. INFORMAZIONI SULL'INDICATORE A differenza di altri indicatori onda Wold, indicatore Forex onda wold MT4 ha una serie di caratteristiche che aumentano notevolmente la sua eff
The indicator displays the data of the Stochastic oscillator from a higher timeframe on the chart. The main and signal lines are displayed in a separate window. The stepped response is not smoothed. The indicator is useful for practicing "manual" forex trading strategies, which use the data from several screens with different timeframes of a single symbol. The indicator uses the settings that are identical to the standard ones, and a drop-down list for selecting the timeframe. Indicator Parame
Heiken Ashi Smoothed Strategy is a very simple but powerful system to get forex market trend direction. This indicator is actually 2 indicators in 1 pack, Heiken Ashi and Heiken Ashi Smoothed Moving Average both included. Because HA (Heiken Ashi) and HAS (Heiken Ashi Smoothed) are calculated in the same one system event with necessary buffers and loop only, so it is the FAST, OPTIMIZED and EFFICIENT HA having the combined indicator of MetaTrader 4. You can choose to display HA and HAS in the sam
Owl smart levels
Sergey Ermolov
4.34 (35)
Versione MT5  |  FAQ L' indicatore Owl Smart Levels   è un sistema di trading completo all'interno dell'unico indicatore che include strumenti di analisi di mercato popolari come i   frattali avanzati di Bill Williams , Valable ZigZag che costruisce   la corretta struttura a onde   del mercato, e i   livelli di Fibonacci che segnano i livelli esatti di entrata nel mercato e luoghi per prendere profitti. Descrizione dettagliata della strategia Istruzioni per lavorare con l'indicatore Consulente-
MACD Max
John Louis Fernando Diamante
A flexible 2-Line MACD indicator The default MACD indicator inside MT4, limits you to using the MACD with a fast-EMA, slow-EMA, and signal-SMA. This MACD indicator allows you to set your own MA-Method choices for these 3 components, separately! You can select from SMA-EMA-SMMA-LWMA-DEMA-TEMA, and can even use a separate method for each 3 fast-slow-signal periods. On-chart colored candles, with drawing condition types is included, with a show/hide button too. Features - MA Methods: SMA, EMA, S
The indicator detects and displays 3 Drives harmonic pattern (see the screenshot). The pattern is plotted by the extreme values of the ZigZag indicator (included in the resources, no need to install). After detecting the pattern, the indicator notifies of that by a pop-up window, a mobile notification and an email. The indicator highlights the process of the pattern formation and not just the complete pattern. In the former case, it is displayed in the contour triangles. After the pattern is com
BoB Trigger AM
Andriy Matviyevs'kyy
The presented indicator is a development of the ideas contained in the Bulls or Bears AM indicator. This indicator displays the difference between the maximum and minimum prices for the current period of time and the values ​​of the channel built using the maximum and minimum prices for a longer period. An increase in indicator values ​​above zero indicates that the maximum price for the current period is greater than the average value of the maximum prices for the period selected as an indicato
[ZhiBiCCI] indicators are suitable for all cycle use, and are also suitable for all market varieties. [ZhiBiCCI] Green solid line is a reversal of bullish divergence. The green dotted line is a classic bullish divergence. [ZhiBiCCI] The solid line to the red is a reverse bearish divergence. The red dotted line is a classical bearish divergence. [ZhiBiCCI] can be set in the parameters (Alert, Send mail, Send notification), set to (true) to send instant signals to the alarm window, email, in
Infinity Trend Pro
Yaroslav Varankin
1 (1)
This is a trend indicator without redrawing Developed instead of the binary options strategy (by the color of the Martingale candlestick) Also works well in forex trading When to open trades (binary options) A signal will appear in the place with a candle signaling the current candle It is recommended to open a deal for one candle of the current timeframe M1 and M5 When a blue dot appears, open a deal up When a red dot appears, open a trade down. How to open trades on Forex. When a signal is rec
Power Renko MT4
Pierce Vallieres
Power Renko is an indicator which plots Renko bricks underneath the chart using a histogram. You can select the brick size and the timeframe of the Renko bricks as well as whether or not to use the close price or the high/low price of the candles. Renko bricks are based on price alone, not time, therefor the Renko bricks will not be aligned with the chart's time. They are extremely useful for trend trading and many different strategies can be formed from them. Buffers are provided allowing you t
The MACD CloseBars indicator is a trading system based on the MACD indicator popular among many traders, which is built on the principle of bars closing above the moving averages selected in the indicator settings. The signal for entering/exiting the market is the frame of the bars colors according to the trend: in case the bars in the main window of the chart are closed above/below the Fast Moving Average, Slow Moving Average individually or both together. Indicator Parameters Fast Moving Ave
The CCI Divergence is a reasonably useful indicator in itself, but it is even more effective when used with divergence pattern trading. The CCI Divergence indicator signal is one of the most potent signals among the indicators that exist in the market. Here is new version for Divergence Indicator using CCI method, with more improvements. Divergences indicate a potential investment point because the directional moment does not confirm the price. A bullish divergence occurs when the underlying
VR Cub
Vladimir Pastushak
VR Cub è un indicatore per ottenere punti di ingresso di alta qualità. L'indicatore è stato sviluppato per facilitare i calcoli matematici e semplificare la ricerca dei punti di ingresso in una posizione. La strategia di trading per la quale è stato scritto l'indicatore ha dimostrato la sua efficacia per molti anni. La semplicità della strategia di trading è il suo grande vantaggio, che consente anche ai trader alle prime armi di commerciare con successo con essa. VR Cub calcola i punti di apert
Insider Scalper Binary This tool is designed to trade binary options. for short temporary spends. to make a deal is worth the moment of receiving the signal and only 1 candle if it is m1 then only for a minute and so in accordance with the timeframe. for better results, you need to select well-volatile charts.... recommended currency pairs eur | usd, usd | jpy .... the indicator is already configured, you just have to add it to the chart and trade .... The indicator signals the next can
The Greed Master Stochastic 2 Lines indicator uses the Stochastic indicator. And based on the data on intersections with the levels , it plots two High and Low lines according to the rates for the change period of the Stochastic indicator. All parameters are set to default, but they can be adjusted if necessary. Also, the arrows show the High and Low price values for the specified period. If you correctly fill parameters of the account and exchange rate of the currency in the country the indicat
Based on MACD indicator waves with standard parameters Applies Fibonacci levels to the last two MACD waves, positive and negative respectively, if at the moment the MACD indicator runs out of negative Wave - the color is green, if at the moment the MACD indicator runs out of positive Wave - the color is red. The Wave termination criterion is two ticks with a different MACD sign. Applies trend lines on the last four MACD Waves. Works well with the expert Figures MACD   https://www.mql5.com/ru/mar
Cet indicateur innovant de mesure de la force des devises de INFINITY est une aide indispensable pour les scalpers et les commerçants qui négocient à long terme. Le système d'analyse De la force/faiblesse des devises est connu depuis longtemps et utilisé sur le marché par les principaux traders du monde. Tout commerce d'arbitrage n'est pas complet sans cette analyse. Notre indicateur détermine facilement la force des devises sous-jacentes les unes par rapport aux autres. Il affiche des graphiqu
FXC iMACD-DivergencE MT4 Indicator This is an advanced MACD indicator that finds trend-turn divergences on the current symbol. The indicator detects divergence between the MACD and the price movements as a strong trend-turn pattern. Main features: Advanced divergence settings Price based on Close, Open or High/Low prices Give Buy/Sell open signals PUSH notifications E-mail sending Pop-up alert Customizeable Information panel Input parameters: MACD Fast-EMA: The Fast-EMA variable of the MACD
COG Candles 2 AM
Andriy Matviyevs'kyy
The product is based on J.F. Ehlers' Center of Gravity indicator. Center of Gravity actually has a zero lag and allows to define turning points precisely. The indicator is a result of Ehlers' research of adaptive filters. It identifies main pivot points almost without any lag.  The indicator colors candlesticks in accordance with COG data. Parameters: Length - indicator calculation period. MaPrice - price used to calculate the indicator. Signal - indicator display options. The indicator does n
This indicator is based on the MACD on one or more timeframes and on any Currency Cross Pair. The indicator generates an alert message when it detects a buy or sell signal. It also draws a vertical bar on the price chart: green for buy or red for sell, yellow if flat. Alert messages and Vertical bars for BUY or SELL, are generated when the MACD is consistent for all chosen timeframes else a FLAT signal is generated. Features Easy flexible settings: Detection of the MACD signal for one or more
Trend Monitor
Pavel Zamoshnikov
4 (4)
The indicator generates early signals basing on ADX reading data combined with elements of price patterns. Works on all symbols and timeframes. The indicator does not redraw its signals. You see the same things on history and in real time. For better visual perception signals are displayed as arrows (in order not to overload the chart). Features Easy to use. Filter configuration only requires selection of sensitivity in the " Sensitivity of the indicator " input. Signals can be filtered usin
Vortex MT4
KEENBASE SOFTWARE SOLUTIONS
The Vortex Indicator was first presented by Douglas Siepman and Etienne Botes in January 2010 edition of Technical Analysis of Stocks & Commodities. Despite its based on a complex implosion phenomenon, the vortex is quite simple to interpret. A bullish signal is generated when +VI line cross above the -VI line and vice versa. The indicator is mostly used as a confirmation for trend trading strategies. The Vortex was inspired by the work of Viktor Schauberger, who studied the flow of water in tur
RSX Signal AM
Andriy Matviyevs'kyy
The indicator displays the signals of the RSX oscillator. The main type of signal is given when the oscillator exceeds the 0 value. If the "Sensitivity" parameter increases above zero, the main signal will also be given when overbought/oversold levels are overcome, defined as zero plus sensitivity and zero minus sensitivity. An additional signal is given when the direction of the oscillator line changes. It is optimal to use the indicator signals as signals to open a trade when the price overcom
Market Trend Catcher indicator analyzes the duration of trend movements and, with a certain development of the current trend, offers market entry points in the form of arrows with recommended profit targets. The indicator is very easy to use and does not require a lot of information to understand how it works. It has a minimum of settings and is transparent in understanding the principle of its operation, fully displaying the information on the basis of which it makes decisions on recommending e
Gli utenti di questo prodotto hanno anche acquistato
Gann Made Easy
Oleg Rodin
4.85 (80)
Gann Made Easy è un sistema di trading Forex professionale e facile da usare che si basa sui migliori principi del trading utilizzando la teoria di mr. WD Gann. L'indicatore fornisce segnali ACQUISTA e VENDI accurati, inclusi i livelli di Stop Loss e Take Profit. Puoi fare trading anche in movimento utilizzando le notifiche PUSH. Vi prego di contattarmi dopo l'acquisto! Condividerò i miei consigli di trading con te e fantastici indicatori bonus gratuitamente! Probabilmente hai già sentito parlar
TPSpro RFI Levels
Roman Podpora
4.81 (21)
Inverti il primo livello di impulso (RFI)       istruire       Russia       -        ESP   Raccomandazione di utilizzare   l'indicatore -   TPSpro   Trend Edizione Professional -Versione   MT5 La cosa più importante nel comercio son è la cosa più importante in futuro. La cosa più importante è la cosa più importante. Funzioni principali: La maggior parte delle zone sono attivate da venditori e compradores! Indicador mostra tutti i livelli/zone dei primi impulsi corretti per acquisti e vendite. LO
Enigmera
Ivan Stefanov
5 (3)
ENIGMERA: Il cuore del mercato https://www.enigmera.com Introduzione Questo indicatore e sistema di trading rappresenta un approccio straordinario ai mercati finanziari. ENIGMERA utilizza i cicli frattali per calcolare con precisione i livelli di supporto e resistenza. Mostra l'autentica fase di accumulazione e fornisce direzione e obiettivi.  Un sistema che funziona sia in un trend che in una correzione.  Come funziona? ENIGMERA è composto da tre linee: la linea di supporto/resistenza, la
Trend Punch
Mohamed Hassan
4.95 (19)
This indicator is unstoppable when combined with our other indicator called  Support & Resistance . After purchase, send us a message and you will get it   for  FREE as a BONUS! Introducing Trend Punch , the revolutionary forex trend indicator that will transform the way you trade! Trend Punch is uniquely designed to provide precise buy and sell arrows during strong market trends, making your trading decisions clearer and more confident. Whether you're trading major currency pairs or exotic sym
TPSproTREND PrO
Roman Podpora
4.79 (19)
TPSpro TREND PRO   è un indicatore di tendenza che analizza automaticamente il mercato, fornisce informazioni sulla tendenza e sui rispettivi cambiamenti e fornisce segnali per entrare nelle operazioni senza ridisegnare. L'indicatore utilizza ciascuna candela e la analizza separatamente. Si riferisce a vari shock al rialzo o al ribasso. Punto di ingresso preciso per il trading di valute, criptovalute, metalli, azioni e indici! Versione MT5                   Descrizione completa dell'indicatore
FX Power MT4 NG
Daniel Stein
5 (12)
Ricevi il tuo aggiornamento quotidiano sul mercato con dettagli e schermate tramite il nostro Morning Briefing qui su mql5 e su Telegram ! FX Power MT4 NG è la nuova generazione del nostro popolare misuratore di forza delle valute, FX Power. Cosa offre questo misuratore di forza di nuova generazione? Tutto ciò che avete amato dell'FX Power originale IN PIÙ Analisi della forza di ORO/XAU Risultati di calcolo ancora più precisi Periodi di analisi configurabili individualmente Limite di calcolo pe
Atomic Analyst
Issam Kassas
5 (2)
Innanzitutto, vale la pena sottolineare che questo indicatore di trading non è repaint, non è ridisegno e non presenta ritardi, il che lo rende ideale sia per il trading manuale che per quello automatico. Manuale utente: impostazioni, input e strategia. L'Analista Atomico è un indicatore di azione del prezzo PA che utilizza la forza e il momentum del prezzo per trovare un miglior vantaggio sul mercato. Dotato di filtri avanzati che aiutano a rimuovere rumori e segnali falsi, e aumentare il pote
Attualmente 20% di sconto! La soluzione migliore per ogni principiante o trader esperto! Questo software per cruscotti funziona su 28 coppie di valute. Si basa su 2 dei nostri indicatori principali (Advanced Currency Strength 28 e Advanced Currency Impulse). Offre un'ottima panoramica dell'intero mercato Forex. Mostra i valori di forza delle valute avanzate, la velocità di movimento delle valute e i segnali per 28 coppie Forex in tutti i (9) timeframe. Immaginate come migliorerà il vostro t
Scalper Inside PRO
Alexey Minkov
4.73 (56)
An exclusive indicator that utilizes an innovative algorithm to swiftly and accurately determine the market trend. The indicator automatically calculates opening, closing, and profit levels, providing detailed trading statistics. With these features, you can choose the most appropriate trading instrument for the current market conditions. Additionally, you can easily integrate your own arrow indicators into Scalper Inside Pro to quickly evaluate their statistics and profitability. Scalper Inside
Trend Screener
STE S.S.COMPANY
4.8 (86)
Indicatore di tendenza, soluzione unica rivoluzionaria per il trading di tendenze e il filtraggio con tutte le importanti funzionalità di tendenza integrate in un unico strumento! È un indicatore multi-timeframe e multi-valuta al 100% non ridipingibile che può essere utilizzato su tutti i simboli/strumenti: forex, materie prime, criptovalute, indici e azioni. OFFERTA A TEMPO LIMITATO: l'indicatore di screening di supporto e resistenza è disponibile a soli 50$ e a vita. (Prezzo originale 250$) (o
ATTUALMENTE SCONTATO DEL 26% La soluzione migliore per ogni principiante o trader esperto! Questo indicatore è uno strumento di trading unico, di alta qualità e conveniente perché abbiamo incorporato una serie di caratteristiche proprietarie e una nuova formula. Con un solo grafico è possibile leggere la forza delle valute per 28 coppie Forex! Immaginate come migliorerà il vostro trading perché sarete in grado di individuare l'esatto punto di innesco di una nuova tendenza o di un'opportunit
Gold Stuff
Vasiliy Strukov
4.89 (237)
Gold Stuff è un indicatore di tendenza progettato specificamente per l'oro e può essere utilizzato anche su qualsiasi strumento finanziario. L'indicatore non ridisegna e non è in ritardo. Periodo consigliato H1. Su di esso l'indicatore funziona in modo completamente automatico Expert Advisor EA Gold Stuff. Lo trovi nel mio profilo. I risultati in tempo reale possono essere visualizzati qui.  Puoi ottenere una copia gratuita del nostro indicatore Strong Support e Trend Scanner, per favore scri
Advanced Supply Demand
Bernhard Schweigert
4.91 (294)
CURRENTLY 26% OFF !! Best Solution for any Newbie or Expert Trader! This indicator is a unique, high quality and affordable trading tool because we have incorporated a number of proprietary features and a new formula. With this update, you will be able to show double timeframe zones. You will not only be able to show a higher TF but to show both, the chart TF, PLUS the higher TF: SHOWING NESTED ZONES. All Supply Demand traders will love it. :) Important Information Revealed Maximize the potenti
- Real price is 80$ - 40% Discount ( It is 49$ now ) Contact me for instruction, any questions! Related EA Product: Bitcoin Expert Introduction The breakout and retest strategy is traded support and resistance levels. it involves price breaking through a previous level.  The break and retest strategy is designed to help traders do two main things, the first is to avoid false breakouts. Many false breakouts start with a candlestick that breaks out of a level but ends with an immediate candlestic
Trend Pulse
Mohamed Hassan
5 (4)
Please contact me after purchase to immediately get your PDF strategy + documentation for Trend Pulse !  Official release price of $79  (3 /50 copies left). Next price is $129 . Introducing Trend Pulse , a unique and robust indicator capable of detecting bullish, bearish, and even ranging trends! Trend Pulse uses a special algorithm to filter out market noise with real precision. If the current symbol is moving sideways, Trend Pulse will send you a ranging signal, letting you know that it'
Order Block Hunter
Noha Mohamed Fathy Younes Badr
5 (2)
Order block hunter indicator is the best indicator for  hunt the order blocks that area where there has been a large concentration of limit orders waiting to be executed Order blocks are identified on a chart by observing previous price action and looking for areas where the price experienced significant movement or sudden changes in direction .This indicator does that for you by using very complicated codes and helps you to take the best areas To buy and sell because it make marks at the best a
Scalper Vault
Oleg Rodin
5 (27)
Scalper Vault è un sistema di scalping professionale che ti fornisce tutto il necessario per scalping di successo. Questo indicatore è un sistema di trading completo che può essere utilizzato dai trader di forex e opzioni binarie. L'intervallo di tempo consigliato è M5. Il sistema fornisce segnali di freccia accurati nella direzione della tendenza. Ti fornisce anche i segnali più alti e più bassi e i livelli di mercato di Gann. Gli indicatori forniscono tutti i tipi di avvisi, comprese le notifi
Trend Cutter è un indicatore di tendenza che può essere utilizzato con qualsiasi intervallo di tempo, inclusi gli intervalli di tempo inferiori come M1 e M5. L'indicatore è ideale per i trader che preferiscono il trading intraday e sarà utile anche per coloro che preferiscono il trading a lungo termine. Puoi utilizzare questo indicatore come base per il tuo sistema di trading o come soluzione di trading autonoma. L'indicatore fornisce tutti i tipi di avvisi, comprese le notifiche PUSH. L'indicat
FX Volume
Daniel Stein
4.58 (33)
Ricevi il tuo aggiornamento quotidiano sul mercato con dettagli e schermate tramite il nostro Morning Briefing qui su mql5 e su Telegram ! FX Volume è il PRIMO e UNICO indicatore di volume che fornisce una visione REALE del sentiment del mercato dal punto di vista del broker. Fornisce informazioni straordinarie su come gli operatori di mercato istituzionali, come i broker, sono posizionati sul mercato Forex, molto più velocemente dei rapporti COT. Vedere queste informazioni direttamente sul vo
ATTUALMENTE SCONTATO DEL 31%! La soluzione migliore per ogni principiante o trader esperto! Questo indicatore è uno strumento di trading unico, di alta qualità e conveniente perché abbiamo incorporato una serie di caratteristiche proprietarie e una formula segreta. Con un solo grafico fornisce avvisi per tutte le 28 coppie di valute. Immaginate come migliorerà il vostro trading perché sarete in grado di individuare l'esatto punto di innesco di una nuova tendenza o opportunità di scalping!
Currency Strength Wizard è un indicatore molto potente che ti fornisce una soluzione all-in-one per un trading di successo. L'indicatore calcola la potenza di questa o quella coppia forex utilizzando i dati di tutte le valute su più intervalli di tempo. Questi dati sono rappresentati in una forma di indice di valuta facile da usare e linee elettriche di valuta che puoi utilizzare per vedere il potere di questa o quella valuta. Tutto ciò di cui hai bisogno è collegare l'indicatore al grafico che
Scopri il segreto per il trading Forex di successo con il nostro indicatore MT4 personalizzato! Ti sei mai chiesto come raggiungere il successo nel mercato Forex, guadagnando costantemente profitti minimizzando il rischio? Ecco la risposta che hai cercato! Permettici di presentare il nostro indicatore MT4 proprietario che rivoluzionerà il tuo approccio al trading. Versatilità unica Il nostro indicatore è appositamente progettato per gli utenti che preferiscono le formazioni di candele Ren
IX Power MT4
Daniel Stein
5 (5)
IX Power porta finalmente l'imbattibile precisione di FX Power ai simboli non-Forex. Determina con precisione l'intensità delle tendenze a breve, medio e lungo termine dei vostri indici preferiti, azioni, materie prime, ETF e persino criptovalute. Potete analizzare tutto ciò che il vostro terminale ha da offrire. Provatelo e sperimentate come il vostro tempismo migliori significativamente durante il trading. Caratteristiche principali di IX Power Risultati di calcolo precisi al 100% e n
Presentazione       Quantum Trend Sniper Indicator   , l'innovativo indicatore MQL5 che sta trasformando il modo in cui identifichi e scambi le inversioni di tendenza! Sviluppato da un team di trader esperti con un'esperienza di trading di oltre 13 anni,       Indicatore Quantum Trend Sniper       è progettato per spingere il tuo viaggio di trading verso nuove vette con il suo modo innovativo di identificare le inversioni di tendenza con una precisione estremamente elevata. *** Acquista Quant
You will get Huge Bonus in case of Full Purchase (not for Rent) contact me after purchase, Leave comment or DM me. Backtest and Read Overview Before buying. Chart patterns have been a topic of debate among traders; some believe they are reliable signalers, while others do not. Our Chart Patterns All-in-One indicator displays various chart patterns to help you test these theories for yourself. The profitability of these patterns is not a reflection of the indicator's effectiveness but rather an e
Break and Retest
Mohamed Hassan
4.18 (17)
This Indicator only places quality trades when the market is really in your favor with a clear break and retest. Patience is key with this price action strategy! If you want more alert signals per day, you increase the number next to the parameter called: Support & Resistance Sensitivity.  After many months of hard work and dedication, we are extremely proud to present you our  Break and Retest price action indicator created from scratch. One of the most complex indicators that we made with ove
Indicator : RealValueIndicator Description : RealValueIndicator is a powerful tool designed specifically for trading on the EURUSD pair. This indicator analyzes all EUR and USD pairs, calculates their real currency strength values, and displays them as a single realistic value to give you a head start on price. This indicator will tell you moves before they happen if you use it right. RealValueIndicator allows you to get a quick and accurate overview of the EURUSD currency pair tops and bottoms,
Currency Strength Exotics
Bernhard Schweigert
4.87 (30)
ATTUALMENTE SCONTATO DEL 20%! La soluzione migliore per qualsiasi principiante o trader esperto! Questo indicatore è specializzato nel mostrare la forza della valuta per qualsiasi simbolo come coppie esotiche, materie prime, indici o futures. È il primo nel suo genere, qualsiasi simbolo può essere aggiunto alla nona riga per mostrare la vera forza della valuta di Oro, Argento, Petrolio, DAX, US30, MXN, TRY, CNH ecc. Si tratta di uno strumento di trading unico, di alta qualità e conveniente
TakePropips Donchian Trend Pro
Eric John Pajarillaga Aldana
4.53 (15)
TakePropips Donchian Trend Pro   (MT4) è uno strumento potente ed efficace che rileva automaticamente la direzione del trend utilizzando il canale Donchian e ti fornisce segnali di trading di entrata e uscita! Questo indicatore multifunzione include uno scanner di tendenza, segnali di trading, pannello statistico, screener, sessioni di trading e dashboard della cronologia degli avvisi. È progettato per fornirti segnali di trading e farti risparmiare ore analizzando i grafici! È possibile scarica
Cycle Sniper
Elmira Memish
4.37 (35)
NEW YEAR SALE PRICE FOR LIMITED TIME!!! Please contact us after your purchase and we will send you the complimentary indicators to complete the system Cycle Sniper is not a holy grail but when you use it in a system which is explained in the videos, you will feel the difference. If you are not willing to focus on the charts designed with Cycle Sniper and other free tools we provide, we recommend not buying this indicator. We recommend watching the videos about the indiactor and system before pu
Altri dall’autore
TTF Candles AM
Andriy Matviyevs'kyy
This indicator displays the moment when the TTF oscillator crosses the zero value, and the moment when the TTF oscillator crosses its smoothed value. Crossing the zero value by the TTF oscillator is a buy/sell signal. If the TTF oscillator crosses its smoothed value, it is a signal of a trend change. The signal is given after the end of the formation of the candle. The signal is confirmed when the price crosses the high/low of the bar on which the signal was given. The indicator does not redraw.
TTF Osc AM
Andriy Matviyevs'kyy
This indicator displays the moment when the TTF oscillator crosses the zero value, and the moment when the TTF oscillator crosses its smoothed value. Crossing the zero value by the TTF oscillator is a buy/sell signal. If the TTF oscillator crosses its smoothed value, it is a signal of a trend change. The signal is given after the end of the formation of the candle. The signal is confirmed when the price crosses the high/low of the bar on which the signal was given. The indicator does not redraw.
FATL Momentum AM
Andriy Matviyevs'kyy
This technical indicator is a Momentum indicators built using a fast adaptive digital filter - FATL. In a simplified sense, an adaptive digital filter is a moving average with effective smoothing. Using a digital filter allows you to smooth out sharp fluctuations with minimal signal delay. Using the indicator: It should be taken into account that the values ​​of the indicator on the zero bar (which has not finished forming yet) may change, so decisions should be made after the end of the bar for
Zone Trade AM
Andriy Matviyevs'kyy
The indicator is based on the elements of Bill Williams' trading system. Sell signals are formed when MACD and OsMA values are falling simultaneously (Bill Williams calls these indicators АО and АС in his book), while buy signals appear when both indicators are rising. Thick and thin colored histograms match MACD and OsMA values. If the histogram is greater than 0, the indicator value is rising. Otherwise, it is falling. Positions should be opened when the price exceeds the bar's high or low, at
ADX Trigger AM
Andriy Matviyevs'kyy
The indicator is an interpretation of the Average Directional Movement Index (ADX) allowing you to determine if there is a price trend. It was developed by Welles Wilder and described in his book "New concepts in technical trading systems". The indicator determines entry points and uses crossing of ADX +/- lines and growth or fall of the main ADX line. When the indicator crosses the zero line, the trend is changed. If the oscillator's value is 1 - the price grows, the trend remains; If the oscil
BarLineBreak AM
Andriy Matviyevs'kyy
The indicator detects the current trend using the following definition: A trend is a market situation when each subsequent peak is higher/lower than the previous one, as well as each subsequent bottom is higher/lower than the previous one. Exceeding all previous peaks/bottoms on the specified amount of bars by the current peak/bottom is considered to be a beginning of a new trend. The indicator paints bars according to an identified trend. The indicator does not repaint. Settings: Lines_Bre
RSI Signal AM
Andriy Matviyevs'kyy
This indicator displays the signals based on the values of the classic RSI indicator on the price chart. The RSI can be used for determining the overbought or oversold areas on the chart. Reaching these levels means that the market can soon turn around, but it does not give signal, as in a strong trend the market can stay in the overbought or oversold state for quite a long time. As with most oscillators, the signals are generated when leaving these areas. This indicator allows to display three
WPR Signal AM
Andriy Matviyevs'kyy
This indicator displays the signals based on the values of the classic WPR indicator. The WPR indicator can be used for determining the overbought or oversold areas on the chart. Reaching these levels means that the market can soon turn around, but it does not give signal, as in a strong trend the market can stay in the overbought or oversold state for quite a long time. As with most oscillators, the signals are generated when leaving these areas. This indicator allows to display three types of
CCI Signal AM
Andriy Matviyevs'kyy
This indicator displays the signals based on the values of the classic CCI indicator on the price chart. The CCI can be used for determining the overbought or oversold areas on the chart. Reaching these levels means that the market can soon turn around, but it does not give signal, as in a strong trend the market can stay in the overbought or oversold state for quite a long time. As with most oscillators, the signals are generated when leaving these areas. This indicator allows to display three
DeM Signal AM
Andriy Matviyevs'kyy
This indicator displays the moment when the DeMarker oscillator crosses its smoothed value. If the DeMarker oscillator crosses its smoothed value, it is a signal of a trend change. The signal is given after the end of the formation of the candle. The signal is confirmed when the price crosses the high/low of the bar on which the signal was given. The indicator does not redraw. Custom Parameters: DeM_Period (>1) - DeMarker indicator period; MA_Period - period for smoothing DeMarker indicator va
ADX Signal AM
Andriy Matviyevs'kyy
The indicator is an interpretation of the Average Directional Movement Index (ADX) allowing you to determine if there is a price trend. It was developed by Welles Wilder and described in his book "New concepts in technical trading systems". The indicator shows signals on the price chart when +DI и -DI intersect and when an ADX value rises or falls relative to the +DI и -DI positional relationship. The indicator's buy signals work just like a support level, while the sell signals work like a resi
Impulsive Trade AM
Andriy Matviyevs'kyy
This indicator displays elements of the trading system described by Alexander Elder. This indicator uses the idea of opening sell deals in the period of MACD (or OsMA) falling below zero and opening buy deals when the indicator values rise above zero, in case this fall or rise coincide with the Moving Average direction. The thick and thin histograms correspond to the values of MACD and OsMA. If a histogram is above 0, the indicator value is greater than 0. If it is below, the indicator value is
FATL Arrows AM
Andriy Matviyevs'kyy
This indicator generates signals when the close price values ​​go beyond the channel built using the FATL fast digital filter. Application is extremely simple: The up arrow is a buy signal. Down arrow - sell signal. The signal must be confirmed by the price breaking the high/low of the bar on which the signal was given. The indicator is effective for trend trading. Thus, to open a position, it is necessary to take into account the trend of a higher period. Signals against the trend of a higher p
RSX Signal AM
Andriy Matviyevs'kyy
The indicator displays the signals of the RSX oscillator. The main type of signal is given when the oscillator exceeds the 0 value. If the "Sensitivity" parameter increases above zero, the main signal will also be given when overbought/oversold levels are overcome, defined as zero plus sensitivity and zero minus sensitivity. An additional signal is given when the direction of the oscillator line changes. It is optimal to use the indicator signals as signals to open a trade when the price overcom
Stop Bar AM
Andriy Matviyevs'kyy
The indicator accurately identifies a short-term trend both on trend and flat markets. The confirmation of the signal is the overcoming by the price of the high/low of the bar on which the signal was given. Signals are given on fully formed bars and are not redrawn. Calculations are based on the system of Moving Averages. The indicator is highly sensitive. Use it together with other technical analysis indicators. Settings: Sensitivity - amount of bars for the indicator calculation (1 or higher
MFI Signal AM
Andriy Matviyevs'kyy
5 (1)
This indicator displays the signals based on the values of the classic Money Flow Index (MFI) indicator on the price chart. The volume is considered during the calculation of the MFI values. The MFI can be used for determining the overbought or oversold areas on the chart. Reaching these levels means that the market can soon turn around, but it does not give signal, as in a strong trend the market can stay in the overbought or oversold state for quite a long time. As with most oscillators, the s
ADX Candles AM
Andriy Matviyevs'kyy
This indicator colors candles in accordance with the projected price movement. The analysis is based on the values of the classic ADX. If the DMI+ line is above the DMI- line - the candlestick is painted in color that signals a price growth; If the DMI+ line is below the DMI- line - the candlestick is painted in color that signals a price fall. The indicator does not redraw on completed candlesticks. The forming candlestick can change its color depending on the current data. Thus, it is recommen
SuperTrend AM
Andriy Matviyevs'kyy
SuperTrend AM is an indicator that allows you to open a position at the very beginning of a significant price movement. The second most important quality of the indicator is the ability to follow the trend as long as possible in order to obtain all potential profits while minimizing potential losses. This indicator does not repaint or not recalculate. A version of this indicator with advanced settings and signal notifications is  SuperTrend 3 AM . Signal of the indicator: red arrow appearing a
HyperSignal AM
Andriy Matviyevs'kyy
The  indicator generates signals for opening positions. The principle of operation is to compare the current average price with a range of average prices over a longer period. The signals are confirmed when the price exceeds the High/Low of the bar where the indicator generated the signal.  Maintenance of an open position is carried out on a smaller TF. Indicator signals to open an opposite position on a smaller TF are a signal to close the deal. This indicator does not repaint or not recalculat
EasyTrend AM
Andriy Matviyevs'kyy
EasyTrend AM is an indicator that allows you to open a position at the very beginning of a significant price movement. The second most important quality of the indicator is the ability to follow the trend as long as possible in order to obtain all potential profits while minimizing potential losses. This indicator does not repaint or not recalculate. A version of this indicator with advanced settings and signal notifications is EasyTrend 3 AM . Signal of the indicator: red arrow appearing abov
FATL Line AM
Andriy Matviyevs'kyy
The presented indicator is a moving average based on the fast digital filter (FATL) data. Using the indicator is similar to using a standard moving average: For small values ​​of the period of the moving average (1-10): Buying/selling is carried out at the moment of changing the direction of the moving average (after the price has overcome the high/low of the bar on which the change of direction occurred). For large values ​​of the period of the moving average: Buying / selling is carried out de
ZT Signal AM
Andriy Matviyevs'kyy
The indicator displays elements of the trading system, name trading in the zone, described by Bill Williams. Sell signals are formed when MACD and OsMA values are falling simultaneously (Bill Williams calls these indicators АО and АС in his book), while buy signals appear when both indicators are rising. The indicator has no configurable parameters. (Indicator variant in which MACD and OsMA parameters can be changed - ZT Signal 2 AM ). The indicator signals are confirmed when the price exceeds t
Fine Trade AM
Andriy Matviyevs'kyy
Not all price changes can be used for trading, as small price fluctuations do not allow you to make a profit. The presented indicator with high efficiency gives signals about the moments of a significant change in the direction of price movement. The indicator is intuitive and easy to use. The indicator signal is generated after the completion of the bar, where the indicator changes its position relative to zero. Never repaints signal. The indicator signals must be confirmed by the price exceedi
TTF Line AM
Andriy Matviyevs'kyy
The indicator analyzes TTF and ATR data to define the current trend and allow traders to gain maximum profit from strong price movements. The indicator is intuitively clear: line direction change - trend direction change. Change of the line color warns of a coming direction change. Customized parameters: Ind_Period (>1) - TTF calculation period; Sensitivity (>1) - ATR sensitivity. Alerts - show a dialog box containing user data; Send_Mail - sends an email using an address specified on the Em
Step RSI AM
Andriy Matviyevs'kyy
This indicator is an interpretation of the values of the classic indicator - RSI. A filter is used to smooth the sharp fluctuations of the indicator values, eliminating the weak changes and focusing the trader's attention on strong fluctuations of values. The indicator is not redrawn on completed bars. For greater efficiency of this indicator, it should be used in conjunction with the indicators that identify the trend direction, as well as support/resistance levels. Signals: Histogram crossing
ADX Line AM
Andriy Matviyevs'kyy
The indicator analyzes ADX and ATR data to define the current trend and allow traders to gain maximum profit from strong price movements. The indicator is intuitively clear: line direction change - trend direction change. Change of the line color warns of a coming direction change. Customized parameters: Ind_Period (>1) - ADX calculation period; Sensitivity (>1) - ATR sensitivity. Alerts - show a dialog box containing user data; Send_Mail - sends an email using an address specified on the Emai
FATL cci AM
Andriy Matviyevs'kyy
The product combines the best features of the standard CCI oscillator with the adaptive digital filter. The indicator allows entering and exiting the market at the very beginning and end of a trend. The indicator generates high-probability signals while retaining high sensitivity. The indicator does not repaint on fully formed bars. Options: Ind_Price - price used for the indicator calculation; Ind_Period - indicator period. Application rules: A big red dot - a strong bearish trend, if the price
FATL Alligator AM
Andriy Matviyevs'kyy
This indicator is a combination of classic trend indicator and signals of the fast digital filter. The indicator has no configurable parameters. The signals are displayed on completed bars and are not redrawn. It shows high efficiency on periods greater than 1 hour. The usage principle is intuitive - trade in the direction shown by the fan of moving averages. Enter once the price exceeds the High/Low of the bar where the signal was formed. Exit on the opposite conditions.
SATL Alligator AM
Andriy Matviyevs'kyy
This indicator is a combination of classic trend indicator and signals of the slow digital filter. The indicator has no configurable parameters. The signals are displayed on completed bars and are not redrawn. It shows high efficiency on periods less than 1 hour. The usage principle is intuitive - trade in the direction shown by the fan of moving averages. Enter once the price exceeds the High/Low of the bar where the signal was formed. Exit on the opposite conditions.
Laguerre Osc 2 AM
Andriy Matviyevs'kyy
The presented indicator uses the Laguerre filter to build an oscillator. The indicator has the possibility of double additional smoothing, which can be useful for small values ​​of the Gamma parameter. The indicator gives three types of signals: Exit of the oscillator from the overbought / oversold zone; The oscillator crossing the middle of the value between the overbought/oversold zones; The oscillator enters the overbought/oversold zone. On fully formed candles, the indicator does not redraw.
Filtro:
Nessuna recensione
Rispondi alla recensione
Versione 26.0 2023.09.12
Updated to version 26+.
Versione 25.3 2023.09.05
Updated.
Versione 25.2 2023.08.06
Update. Typo fixed.
Versione 25.1 2023.08.05
Fixed bug.