Wave Cycle Explorer
- Indicatori
- Vitalyi Belyh
- Versione: 1.0
- Attivazioni: 7
Uno strumento di tendenza per il trading, l'analisi e la previsione della situazione del mercato.
L'indicatore include una linea guida che funge da guida per le onde di tendenza, giornaliere o settimanali. E uno speciale oscillatore che analizza i volumi degli scambi.
Mostra periodi di mercati ipercomprati e ipervenduti e determina i punti di ingresso all'inizio di un potenziale movimento di prezzo.
L'indicatore non ridisegna e non è in ritardo.
Funziona su qualsiasi strumento e Time Frame.
L'indicatore non carica il grafico, contiene solo 2 impostazioni, può essere utilizzato come indicatore indipendente per il trading.
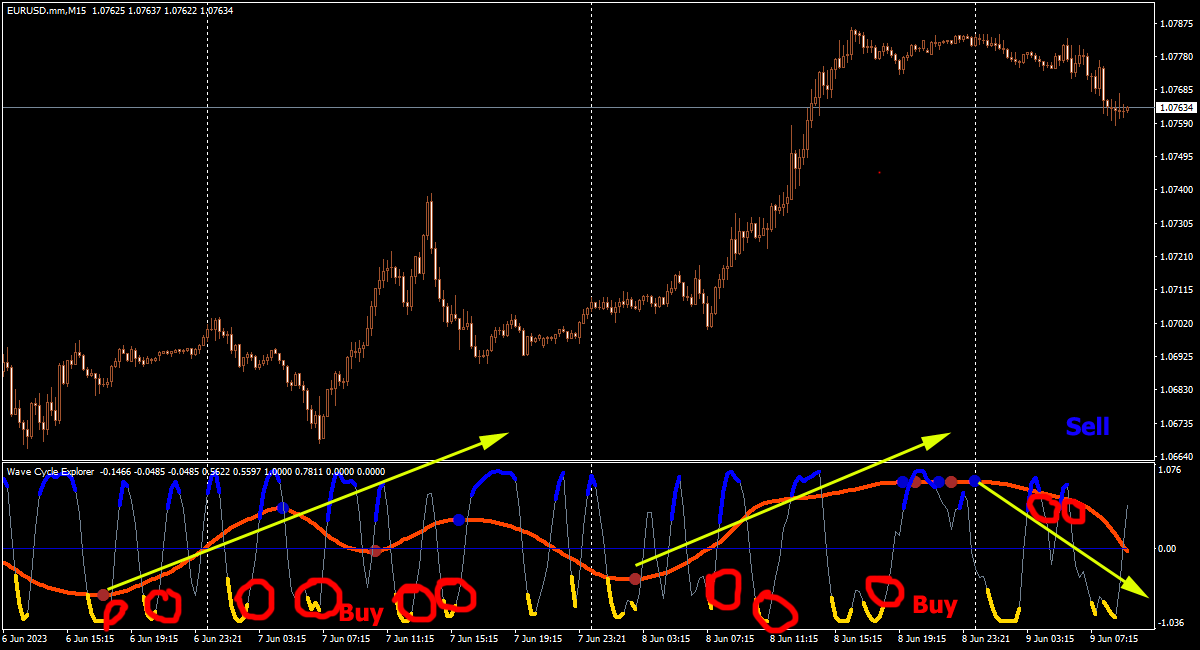
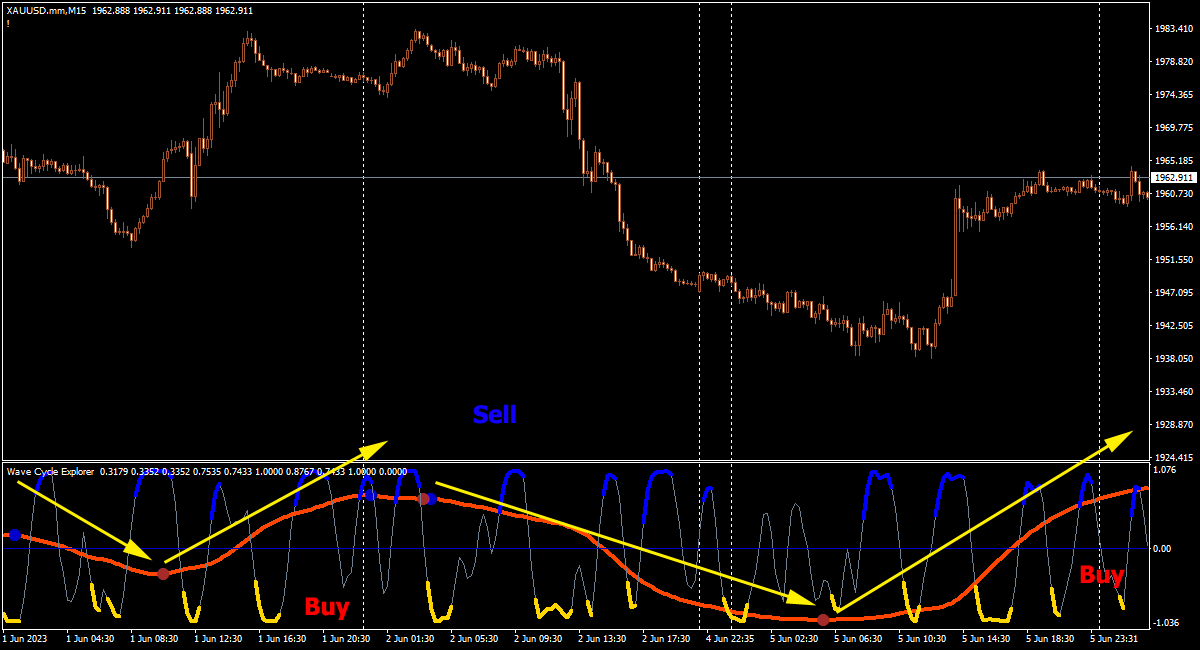
La linea guida arancione dell'indicatore dà un'idea del movimento del mercato. Quando la linea scende - il mercato è ribassista, quando sale - il mercato è rialzista, anche se la linea è sopra lo 0, prevale il mercato rialzista,
se la linea è inferiore a 0, prevale un mercato ribassista. I punti di svolta sono indicati da cerchi.
L'oscillatore del segnale è una linea grigia, fornisce entrate durante i movimenti del prezzo dell'onda, funziona nel momento in cui la linea esce dagli intervalli superiore e inferiore. Le zone di massimo ipercomprato e ipervenduto sono colorate di giallo e blu.
L'uscita della linea dell'oscillatore dalla zona di ipercomprato e ipervenduto mostra un possibile cambiamento nella direzione del prezzo.
Non fare trading contro l'oscillatore.
L'indicatore ha impostazioni standard per i tempi M5-M15, per altri tempi è necessario modificare i parametri.
Parametri di input
L'indicatore include una linea guida che funge da guida per le onde di tendenza, giornaliere o settimanali. E uno speciale oscillatore che analizza i volumi degli scambi.
Mostra periodi di mercati ipercomprati e ipervenduti e determina i punti di ingresso all'inizio di un potenziale movimento di prezzo.
L'indicatore non ridisegna e non è in ritardo.
Funziona su qualsiasi strumento e Time Frame.
L'indicatore non carica il grafico, contiene solo 2 impostazioni, può essere utilizzato come indicatore indipendente per il trading.
La linea guida arancione dell'indicatore dà un'idea del movimento del mercato. Quando la linea scende - il mercato è ribassista, quando sale - il mercato è rialzista, anche se la linea è sopra lo 0, prevale il mercato rialzista,
se la linea è inferiore a 0, prevale un mercato ribassista. I punti di svolta sono indicati da cerchi.
L'oscillatore del segnale è una linea grigia, fornisce entrate durante i movimenti del prezzo dell'onda, funziona nel momento in cui la linea esce dagli intervalli superiore e inferiore. Le zone di massimo ipercomprato e ipervenduto sono colorate di giallo e blu.
L'uscita della linea dell'oscillatore dalla zona di ipercomprato e ipervenduto mostra un possibile cambiamento nella direzione del prezzo.
Non fare trading contro l'oscillatore.
L'indicatore ha impostazioni standard per i tempi M5-M15, per altri tempi è necessario modificare i parametri.
Parametri di input
- Trend Direction - analizza il numero di barre per calcolare la direzione del trend.
- Signal Oscillator - Analizza il numero di barre per calcolare l'oscillatore del segnale.
- Bars Count - il numero di barre dell'indicatore sul grafico.