Better Daily Range
- Indicators
- Silk Road Trading LLC
- Version: 1.2
- Updated: 15 August 2023
- Activations: 20
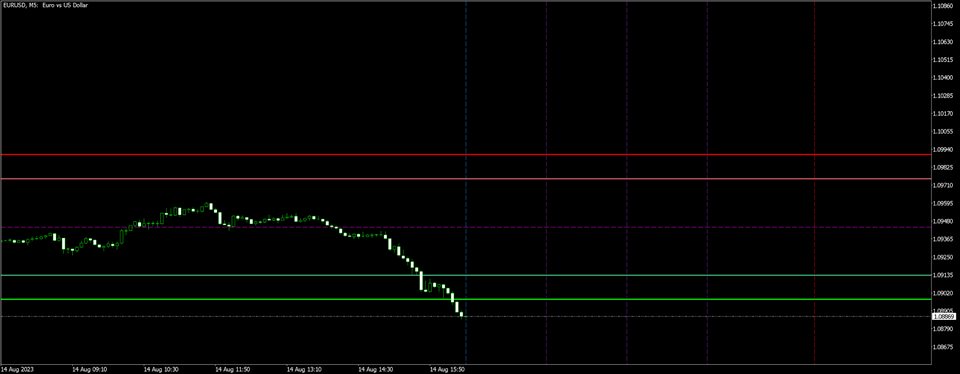
The Better Daily Range indicator shows the previous trading day's price range on the current day's chart. Many traders mark out the previous day's high, low, and the current day's open before trading.
- This is not an average true range indicator (ATR).
- This is not an average daily range indicator (ADR).
- This is a daily range indicator (DR).
- This indicator shows horizontal maximum and minimum range lines.
- If your broker-dealer's MT5 platform shows Sunday bars, Sunday bars are not included as previous days. In other words, Monday uses Friday's price data (skips Sunday).
- This indicator also shows two 25% (of range) breakout lines: one that is 25% higher than the maximum range line, and one that is 25% lower than minimum range line.
- A middle range line is also shown.
- Immediately after the daily close of your broker-dealer, all five range lines update to the new daily values.
- A local market open time line (a vertical line),
- A local market middle time A line (a vertical line),
- A local market middle time B (a vertical line),
- A local market middle time C (a vertical line),
- A local market close time (a vertical line), and
- A local market open price (a horizontal line). The location of the local market open price depends on your input local market open time. In other words, you input your desired market open time according to your local machine/device time and the indicator automatically shows all five session lines. When your incoming price bars reach your input local market open time line, the indicator automatically shows the price to appear at your input local market open time.
- If your broker-dealer's MT5 platform shows Sunday bars, the time separator lines do not show on a Sunday.
- Immediately after midnight local machine/device time, the five session time lines (vertical lines) are projected forward into the current day (into the future hours) and the local open price line is erased. The local open price line reappears when the price bars on the chart reach your input local open time (your local machine/device time).
The indicator has the following inputs (settings):
- Chart symbol of source chart [defaults to: EURUSD] - Allows you to show data from another chart symbol other than the current chart symbol. Handy for showing standard timeframe data on an MT5 Custom Chart.
- Local trading session start hour [defaults to: 09] - Set your desired start hour for trading according to the time displayed on your local machine/device operating system (all times below are your local machine/device operating system times). The default setting, 09, means 9:00am.
- Local trading session start minute [defaults to: 30] - Set your desired start minute. The default setting, 30, means 30 minutes. Both the default hour and the default minute together mean 9:30am.
- Local trading session hour A [defaults to: 11] - Set your desired middle hour A for stopping trading when volume tends to decrease during the first half of lunch time. The default setting, 11, means 11:00am.
- Local trading session minute A [defaults to: 00] - Set your desired middle minute A. Both the default hour and the default minute together mean 11:00am.
- Local trading session hour B [defaults to: 12] - Set your desired middle hour B for the second half of lunch time. The default setting, 12, means 12:00pm (noon).
- Local trading session minute B [defaults to: 30] - Set your desired middle minute B. Both the default hour and the default minute together mean 12:30pm.
- Local trading session hour C [defaults to: 14] - Set your desired middle hour C for resuming trading when volume tends to increase. The default, 14, means 2:00pm.
- Local trading session minute C [defaults to: 00] - Set your desired middle minute C. Both the default hour and the default minute together mean 2:00pm.
- Local trading session end hour [defaults to: 16] - Set your desired end hour for stopping trading. The default setting, 16, means 4:00pm.
- Local trading session end minute [defaults to: 00] - Set your desired end minute for stopping trading. Both the default hour and the default minute together mean 4:00pm.
- High plus 25% line color [defaults to: Red].
- High plus 25% line style [defaults to: Soid].
- High plus 25% line width [defaults to 4].
- High line color [defaults to: IndianRed].
- High line style [defaults to: Solid].
- High line width [defaults to: 4].
- Middle line color [defaults to: Magenta].
- Middle line style [defaults to: Dashed].
- Middle line width [defaults to: 1].
- Low line color [defaults to: MediumSeaGreen].
- Low line style [defaults to: Solid].
- Low lien width [defaults to: 4].
- Low minus 25% line color [defaults to: Lime].
- Low minus 25% line style [defaults to: Solid].
- Low minus 25% line width [defaults to: 4].
- Local market open line color [defaults to: DodgerBlue].
- Local market open line style [defaults to: Dashed].
- Local market open line width [defaults to: 1].
- Local market middle lines color [defaults to: DarkOrchid].
- Local market middles lines style [defaults to: Dashed].
- Local market middles lines width [defaults to: 1].
- Local market close line color [default: Red].
- Local market close line style [Dashed].
- Local market close line width [1].
- Local market open price color [White].
- Local market open price style [Dot dashed with double dots].
- Local market open price width [1].
The lines of this indicator can be called in an Expert Advisor by way of MQL5 Object Functions.
