How to Start with Metatrader 5 - page 54
You are missing trading opportunities:
- Free trading apps
- Over 8,000 signals for copying
- Economic news for exploring financial markets
Registration
Log in
You agree to website policy and terms of use
If you do not have an account, please register
Forum on trading, automated trading systems and testing trading strategies
Indicators: Point and Figure
Sergey Golubev, 2014.03.15 18:36
Point & Figure Part I (based on dailyfx article)
The History of Point & Figure Charts
Unlike other charting methods, there is no one person credited for creating Point & Figure charts. Before computers, Point & Figures were adapted from a method used by floor traders in the 19th and pre-computer 20th century. The basic premise that caused P&F to be born is that there needed to be a simple method for floor traders to record price action to analyze price without unnecessary noise. Over a handful of years, two charts converged into one type of chart known as Point & Figure Charts.
To make sense of the far-right chart above, it may be helpful to know what creates a new column which will be explained in detail later in the article. The chart on the right requires a reversal of 3 boxes of $1 each or $3 move against the prior trend to print a new column. As you can see, instead of price being printed, a column of X’s or O’s will occupy the chart.
The first method on the left was simply recording prices up and down without fractions which, you can imagine would become mind-numbing overtime. To make analysis less tedious and thus trading easier, a point chart above was constructed with price marked once on the y-axis and then marked an “X” or “point” for either direction when any whole figure was crosses. The Forex equivalent of this would be an Average True Range equivalent or 1XATR or 100 Pips.
Why Traders Use Point & Figure Charts
Due to technology, Point & Figure charts have fallen out of favor due to the likely fact that Point & Figure charts do not update in real-time, for a reason you’ll soon learn, and they may not appear as exciting as a short-term scalping chart. Point & Figure charts do not utilize time but only price. Therefore, you will not see a new candle print because there is a new day or time period like you do with candlestick charts. If price has not reversed or broken out from your predetermined levels discussed below, then there will be no change to the chart. In other words, the Point & Figure charts are famously objective.
The Construction of Point & Figure Charts
Constructing the Point & Figure chart takes some decisions on your part that we’ll discuss shortly. Another great advantage to Point & Figure charts as you’ll see is that you have control over how much action you see.
There are 3 main components that will be needed to construct a Point & Figure charts. The components are:
Once these three components are determined, you will come up with a specific name for your Point & Figure chart like a 10X3 chart or 1ATRX3 chart for example. This name type comes from Box size X Reversal. Also, please note that higher prices will be marked by X’s and O’s for down-columns.
The reversal size will determine how sensitive your charts are. This will be determined by how many X’s or O’s the price must reverse before changing columns. The most common choices are 1-box reversals and 3-box reversals. A 3-box reversal chart will require 3x the amount of price action against the prior trend before reversing than a 1-box reversal.
Closing Thoughts
Today’s introduction to Point & Figure opens up an exciting avenue of analysis for your trading. It may be helpful for you to see Point & Figure as a new objective way of identifying price action but not necessarily a chart that you will enter trades on.
Forum on trading, automated trading systems and testing trading strategies
Indicators: Point and Figure
Sergey Golubev, 2013.09.12 16:29
Point & Figure Charting
Point & Figure Charting reduces the importance of time on a chart and instead focuses on price movements. Point & Figure charts are made up of X's and O's, X's being new highs and O's being new lows. There are two inputs to a Point & Figure chart:
One of the main uses for Point & Figure charts, and the one emphasized in this section, is that Point & Figure charts make it easier for traders to see classic chart patterns. In the chart below of the E-mini S&P 500 Future, the Point & Figure chart emphasized support and resistance lines as well as areas of price breakouts:
Again, the Point & Figure chart makes it easy for traders to see the double bottom pattern below in the chart of the E-mini S&P 500 Futures contract:
The e-mini chart above illustrates the two bottoms of the double bottom pattern, as well as the confirmation line that is pierced, resulting in a buying opportunity.
Point & Figure is a very unique way to plot market action. The strongsuit of Point & Figure charting is that it eliminates the element of time and focuses on what is truly important - priceForum on trading, automated trading systems and testing trading strategies
How to Start with Metatrader 5
Sergey Golubev, 2014.05.07 18:18
Just a reminderThere is good article concerning to fundamental trading (for creation of the EAs related to News Trading) :
============
Building an Automatic News Trader
As Investopedia states, a news trader is "a trader or investor who makes trading or investing decisions based on news announcements". Indeed, economic reports such as a country's GDP, consumer confidence indexes and employment data of countries, amongst others, often produce significant movements in the currency markets. Have you ever attended a U.S. Non-Farm Payrolls release? If so, you already know that these reports may determine currencies' recent future and act as catalysts for trends reversals.
Forum on trading, automated trading systems and testing trading strategies
help about signals tab
Alain Verleyen, 2014.03.28 13:23
That question has been asked numerous time, please do some search before posting : MQL5.com Search - Quick, Easy and Convenient!
About signal tab :
Contact your Broker, not all Brokers offer signals on MT4
Is this enough ?
Forum on trading, automated trading systems and testing trading strategies
All about Calendar tab and Macro Economic Events.
Alain Verleyen, 2013.03.17 16:54
For traders
MT5 user interface
Analysis
For developers
Forum on trading, automated trading systems and testing trading strategies
All about Calendar tab and Macro Economic Events.
Alain Verleyen, 2013.04.13 21:20
From this comment, newdigital, provide a good list of possible improvements for calendar/news :
If you have some others ideas, you can post to this topic.
Forum on trading, automated trading systems and testing trading strategies
PriceChannel Parabolic system
Sergey Golubev, 2013.03.22 14:04
PriceChannel Parabolic system
PriceChannel Parabolic system basic edition
Latest version of the system with latest EAs to download
How to trade
The settingas for EAs: optimization and backtesting
Trading examples
Metaquotes demo
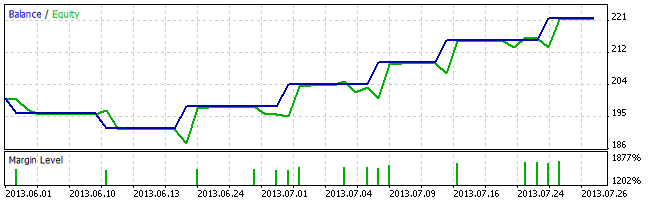
GoMarkets broker, initial deposit is 1,000
Alpari UK broker initial deposit is 1,000
RoboForex broker initial deposit is 1,000
Forum on trading, automated trading systems and testing trading strategies
How to Start with Metatrader 5
Sergey Golubev, 2015.02.03 18:48
Market condition setup (indicators and template) is hereForum on trading, automated trading systems and testing trading strategies
Gold is Reaching at 1270
Sergey Golubev, 2013.07.01 21:04
How can we know: correction, or bullish etc (in case of using indicator for example)?
well ... let's take AbsoluteStrength indicator from MT5 CodeBase.
bullish (Bull market) :
bearish (Bear market) :
ranging (choppy market - means: buy and sell on the same time) :
flat (sideways market - means: no buy and no sell) :
correction :
correction in a bear market (Bear Market Rally) :
Forum on trading, automated trading systems and testing trading strategies
News EA
Sergey Golubev, 2014.07.04 20:35
Forum on trading, automated trading systems and testing trading strategies
Market Condition Evaluation based on standard indicators in Metatrader 5
Sergey Golubev, 2013.09.01 21:06
This my post? red dotted lines are for possible sell stop trade, blue dotted lines are are possible buy stop ...
=============
Anyway - I just copied some latest summary from this thread :
=============
Market Condition Evaluation
story/thread was started from here/different thread
================================
Market condition
================================
3 Stoch MaFibo trading system for M5 and M1 timeframe
================================
PriceChannel ColorPar Ichi system.
================================
MaksiGen trading system
================================
Merrill's patterns are on this page.
================================
Divergence - how to use, explanation and where to read about.
================================
Scalp_net trading system
================================
MTF systems
more to follow ...
================================
MA Channel Stochastic system is here.
================================
Ichimoku