Market Condition Evaluation based on standard indicators in Metatrader 5 - page 182
You are missing trading opportunities:
- Free trading apps
- Over 8,000 signals for copying
- Economic news for exploring financial markets
Registration
Log in
You agree to website policy and terms of use
If you do not have an account, please register
Forum on trading, automated trading systems and testing trading strategies
Forecast for Q3'16 - levels for Bovespa Index
Sergey Golubev, 2016.07.20 10:28
Bovespa Index - Long-Term Forecast: monthly breakout for the long-term bullish
Monthly price is located inside Ichimoku cloud for the breakout with the bullish reversal to be started on open monthly bar for now:
Absolute Strength indicator is estimating the long-term bullish trend in the near future.
SUMMARY : breakout
TREND : possible bullish reversalForum on trading, automated trading systems and testing trading strategies
USDCAD Technical Analysis 2016, 17.07 - 24.07: bullish ranging near bearish reversal
Sergey Golubev, 2016.07.20 15:08
USD/CAD Technical Analysis - intra-day bullish breakout, daily bullish trend to be resumed, weekly possible bullish reversal
Daily price is on bullish condition to be above Ichimoku cloud with the ranging within the following key support/resistance levels:
Chinkou Span line and Absolute Strength indicator are estimating the bullish condition to be continuing.
If D1 price breaks 1.2860 support level on close bar so the bearish reversal will be started.If D1 price breaks 1.3139 resistance level on close bar from below to above so the primary bullish trend will be continuing.
If not so the price will be on ranging within the levels.
Forum on trading, automated trading systems and testing trading strategies
Forecast for Q3'16 - levels for Hang Seng Index (HSI)
Sergey Golubev, 2016.07.21 20:32
Hang Seng Index (HSI) Technical Analysis: new daily resistance on the way to the bullish continuation
Daily price is continuing with the primary bullish trend with new 'top' to be formed for the bullish trend to be continuing. The price is located within the following support/resistance levels:
Absolute Strength indicator is estimating the ranging bullish condition, and Chinkou Span line is located above the price for the primary bullish trend to be continuing in the future.
If D1 price breaks 21,558 support level on close bar so the local downtrend as the secondary correction within the primary bullish market condition will be started.
If D1 price breaks 22,087 resistance level on close bar so the bullish trend will be continuing.
If not so the price will be on ranging within the levels.
SUMMARY : bullish
Forum on trading, automated trading systems and testing trading strategies
Forecast for Q3'16 - levels for S&P 500
Sergey Golubev, 2016.07.21 21:02
S&P 500 Intra-Day Technical Analysis - daily correction to be started
H4 price is located above Ichimoku cloud in the bullish area of the chart. The price was bounced from 2169.50 resistance level to below for the possible correction to be started. Chinkou Span line is crossing the price on open H4 bar to below for the good possible breakdown, and Absolute Strength indicator is estimating the correction within the bullish in the near future.
If H4 price breaks 2148.75 support level on close bar so the local downtrend as the secondary correction will be started.
If H4 price breaks 2169.50 resistance level on close bar so the bullish trend will be continuing.
If not so the price will be on ranging within the levels.
SUMMARY : bullish
TREND : possible daily correctionForum on trading, automated trading systems and testing trading strategies
Forecast for Q3'16 - levels for US Dollar Index
Sergey Golubev, 2016.07.22 16:50
Dollar Index: End Of Week Technicals - Bullish To Continue or Correction To Be Started?
This trading week ended with some dilemma: bullish trend to be continuing in case the price breaks 97.32 resistance level, or the secondary correction to be started just in case of support level at 96.79 to be broken to below.
------------------
D1 price is on located above Ichimoku cloud for the bullish market condition with the ranging within 97.32/96.79 narrow levels.
H4 price is on bullish ranging with 97.21 resistance level to be tested for 97.32 level as a nearest target to re-enter. Chinkou Span line of Ichimoku indicator is located above the price for the bullish trend to be continuing by the direction. Absolute Strength insdicator is estimating the possible bullish breakout in the near future.
If H4 price breaks 97.32 resistance level on close bar so the primary bullish trend will be continuing.If H4 price breaks 96.79 support so the bearish reversal may be started with the secondary ranging way.
If not so the price will be ranging within the levels.
SUMMARY : bullish
TREND : rangingForum on trading, automated trading systems and testing trading strategies
Forecast for Q3'16 - levels for NZD/USD
Sergey Golubev, 2016.07.22 20:22
Next Week Forecast: the most interesting pair you can make money with - NZD/USD
NZD/USD: breakdown with the bearish reversal. The pair is on secondary correction within the primary bullish condition with 0.6950 support level to be testing to below for the reversal of the price movement to the primary bearish market condition. The price is located within the following key support/resistance levels:
Descending triangle pattern was formed by the price to be crossed to below for the bearish trend to be started.
There are 2 simple scenarios for the price movement for the week:
Chinkou Span line is crossing the price to below on open daily bar for the possible daily breakdown.
Forum on trading, automated trading systems and testing trading strategies
EURUSD Technical Analysis 2016, 24.07 - 31.07: daily bearish and weekly bearish reversal with 1.0911 as a target
Sergey Golubev, 2016.07.24 08:01
Daily price is located below Ichimoku cloud and Senkou Span line which is the virtual border between the primary bearish and the primary bullish trend on the chart. The price is breaking 1.0979 support level to below for the bearish trend to be continuing with 1.0911 level as a nearest target to re-enter. Descending triangle pattern was formed by the price to be break for the downtrend, and Absolute Strength and Trend Strength indicators are estimating the bearish trend to be continuing on the future.
If D1 price breaks 1.0911 support level on close bar so the bearish trend will be continuing up to bottom to be formed.If D1 price breaks 1.1164 resistance level on close bar from below to above so the reversal of the price movement to the primary bullish market condition will be started.
If not so the price will be on ranging bearish within the levels.
SUMMARY : possible bearish breakdown
TREND : bearishForum on trading, automated trading systems and testing trading strategies
Press review
Sergey Golubev, 2016.07.25 07:40
Weekly Outlook by Morgan Stanley and EUR/USD Intra-Day Technical Analysis (adapted from the article)
"This week's ECB meeting provided few surprises and did not commit to easing in September. Our view is even if they do cut by 10bps, in line with our economists' expectations, it will not do much for EUR given banking sector weakness and already extremely low yields. The EBA's stress test needs to be watched as it could bring EMU's banking sector back into focus. We still see upside potential for EUR in the medium term on the basis of real yield differentials, and like buying against USD and particularly GBP."
H1 price is located below SMA with period 100 (100 SMA) and below SMA with the period 200 (200 SMA) waiting for the bearish trend to be continuing or to the bear market rally to be started.
SUMMARY : ranging
TREND : bearishForum on trading, automated trading systems and testing trading strategies
Press review
Sergey Golubev, 2016.07.26 13:10
Trading News Events: The Conference Board Consumer Confidence
2016-07-26 14:00 GMT | [USD - CB Consumer Confidence]
if actual > forecast (or previous one) = good for currency (for USD in our case)
[USD - CB Consumer Confidence] = Level of a composite index based on surveyed households.
==========
What’s Expected:From the article:
==========
EUR/USD H1: bullish ranging near bearish reversal. The price is on ranging near and above Ichimoku cloud within the following key reversal support/resistance levels:
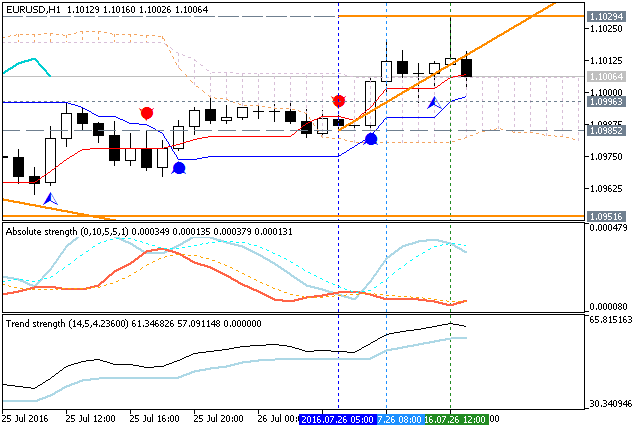
If the price breaks 1.0985 support level to below on close H1 bar so the bearish reversal will be started.If the price breaks 1.1029 resistance to above on close H1 bar so the bullish reversal will be continuing.
If not so the price will be continuing with the ranging within the levels.
=========
AUD/USD H1: ranging for the bullish continuation or for the bearish reversal. The price is located above Ichimoku cloud in the bullish area of the chart for the ranging within the following key reversal support/resistance levels:
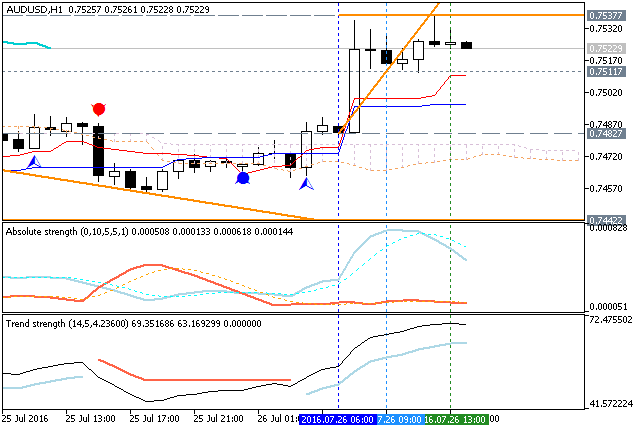
If the price breaks 0.7582 support level to below on close H1 bar so the bearish reversal will be started.If the price breaks 0.7537 resistance to above on close H1 bar so the bullish reversal will be continuing.
If not so the price will be continuing with the ranging within the levels.
Forum on trading, automated trading systems and testing trading strategies
Press review
Sergey Golubev, 2016.07.27 17:55
Trading News Events: Federal Open Market Committee Interest Rate Decision (adapted from the article)
2016-07-27 18:00 GMT | [USD - Federal Funds Rate]
if actual > forecast (or previous one) = good for currency (for USD in our case)
[USD - Federal Funds Rate] = Interest rate at which depository institutions lend balances held at the Federal Reserve to other depository institutions overnight.
==========
What’s Expected:Why Is This Event Important:
"With Fed Funds Futures reflecting limited expectations for higher borrowing-costs in 2016, Chair Janet Yellen and Co. may largely endorse a wait-and-see approach for monetary policy as the central bank argues market-based measures of inflation compensation remains weak while ‘most survey-based measures of longer-term inflation expectations are little changed, on balance, in recent months.’"
==========
EUR/USD H1: bearish reversal. The price broke Ichimoku cloud to below for the possible bearish reversal with 1.0984 support level to be testing for the bearish trend to be started. The price is located now within the following support/resistance levels:
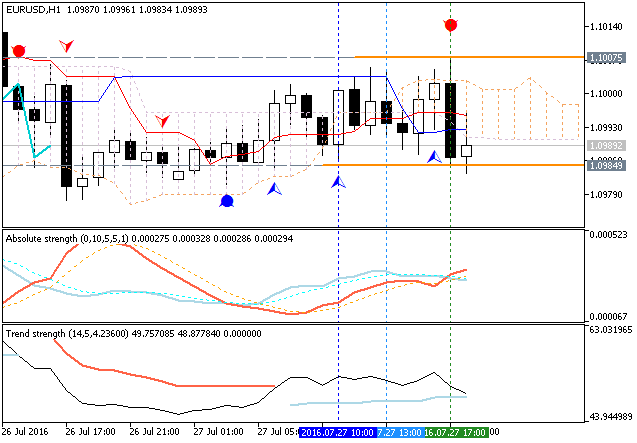
If the price breaks 1.0984 support level to below on close H1 bar so the primary bearish trend will be started.If the price breaks 1.1007 resistance to above on close H1 bar so we may see the reversal of the price movement to the bullish market condition.
If not so the price will be continuing with the ranging within the levels.
EUR/USD M5: 39 pips range price movement by Federal Open Market Committee Interest Rate Decision news event