Forum on trading, automated trading systems and testing trading strategies
Sergey Golubev, 2016.09.03 10:17
Weekly Outlook: 2016, September 04 - September 11 (based from the article)
Kuroda’s speech, Rate decision in Australia, Canada the EU, Employment data in the US and Canada as well as US Crude Oil Inventories. These are the highlights of this week.

- Haruhiko Kuroda speaks: Monday, 4:30. Bank of Japan Governor Haruhiko Kuroda will speak in Tokyo. Volatility is expected.
- Australian rate decision: Tuesday, 4:30. Economists anticipate more easing measures in the coming months with a 68% chance for another cut is December.
- US ISM Non-Manufacturing PMI: Tuesday, 16:00. The ISM Non-Manufacturing index is expected to reach 55.4 this time.
- Australian GDP: Wednesday, 1:30.
- Canadian rate decision: Wednesday, 14:00. Economists do not expect a change in monetary policy anytime soon.
- EU rate decision: Thursday, 11:45. Analysts expect the ECB will act in the fall or winter to extend its bond-buying stimulus program past its expiry date of March 2017.
- US Unemployment rate: Thursday, 12:30.
- US Crude Oil Inventories: Thursday, 15:00. This unexpected trend cast shadow over the oil industry in the coming months.
- Canadian Employment data: Friday, 12:30.
Forum on trading, automated trading systems and testing trading strategies
Market Condition Evaluation based on standard indicators in Metatrader 5
Sergey Golubev, 2016.09.05 08:47
The most interesting pair you can make money with - EUR/NZD
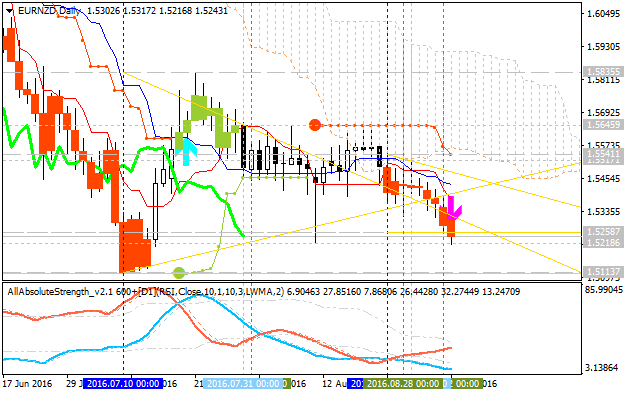
EUR/NZD: bearish breakdown. This pair is on bearish market condition condition for the breakdown to be started on open daily bar for now: the price is breaking 1.5218 support level to below for the breakdown to be continuing. Chinkou Span line of Ichimoku indicator is located below the price indicating the bearish trend to be continuing on good breakdown way.
The most likely scenarios for the price movement for the week:
If daily price breaks 1.5218 support level to below on close bar so the daily breakdown will be continuing with 1.5113 bearish target to re-enter, if not so the price will be on bearish ranging within the levels.
There are the following news events which will be affected on EUR/NZD price movement for the coming week:
- 2016-09-05 09:00 GMT | [EUR - Retail Sales]
- 2016-09-06 06:00 GMT | [EUR - German Factory Orders]
- 2016-09-06 09:00 GMT | [EUR - GDP]
- 2016-09-06 14:00 GMT | [USD - ISM Non-Manufacturing PMI]
- 2016-09-06 22:45 GMT | [NZD - Manufacturing Sales]
- 2016-09-07 06:00 GMT | [EUR - German Industrial Production]
- 2016-09-08 11:45 GMT | [EUR - Minimum Bid Rate]
- 2016-09-08 12:30 GMT | [EUR - ECB Press Conference]
- 2016-09-08 15:00 GMT | [USD - Crude Oil Inventories]
- 2016-09-09 06:00 GMT | [EUR - German Trade Balance]
- 2016-09-09 11:45 GMT | [USD - FOMC Member Rosengren Speaks]
| Resistance | Support |
|---|---|
| 1.5541 | 1.5218 |
| 1.5835 | 1.5113 |
Forum on trading, automated trading systems and testing trading strategies
Sergey Golubev, 2016.09.06 09:00
What’s Wrong With EUR/USD? (adapted from the article)
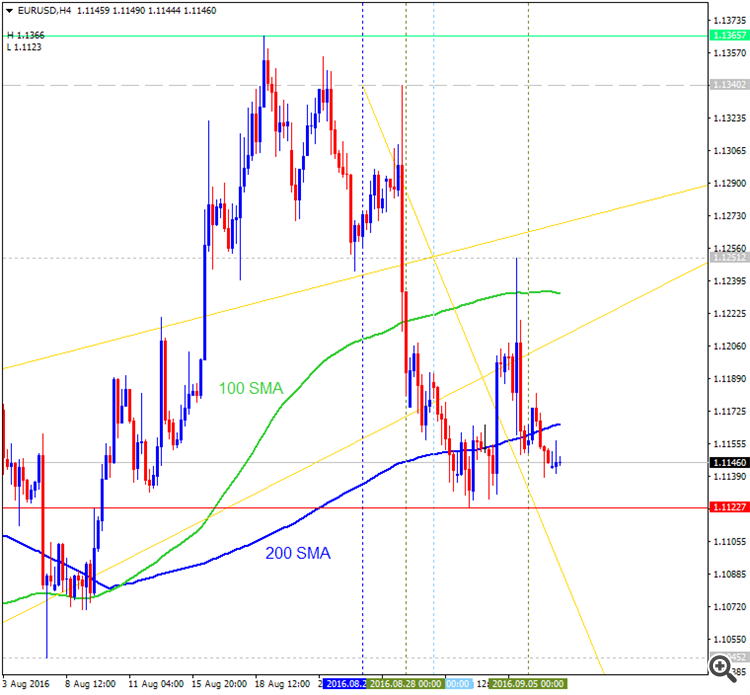
- H4 price broke 200 SMA to be reversed to the bearish market condition. The price is testing 1.1122 support level for the bearish trend to be continuing.
- "No matter what the economic data is, the EURUSD is having a hard time falling. Actually, it is being bought on each and every dip and people wonder if it isn’t a wise decision to actually buy the pair and hold the position instead of shorting it. The EURUSD outlook looks bearish, though."
- Daily price is located within 100 SMA/200 SMAL the price is testing 200 SMA together with 1.1122 support level to below to be reversed to the primary ebarish market condition.
- "EURUSD Bearish on Bigger Time Frames. The reason why the EURUSD is not falling (yet!) is not that the pair is bullish or something, but because the pattern that broke lower is on a big time frame: the daily chart."
According to the post above - and related to 1.1122 bearish reversal level so this level is valid for Ichimoku daily chart as well:
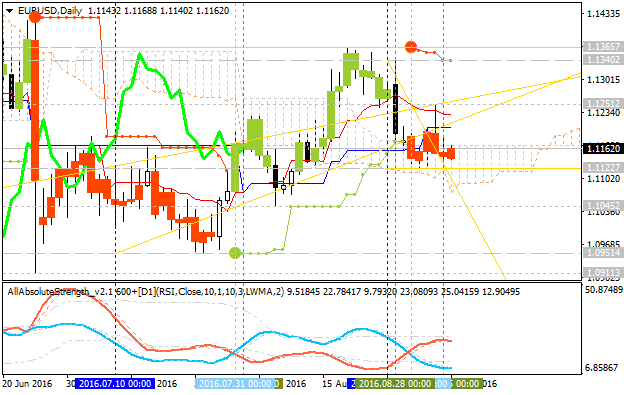
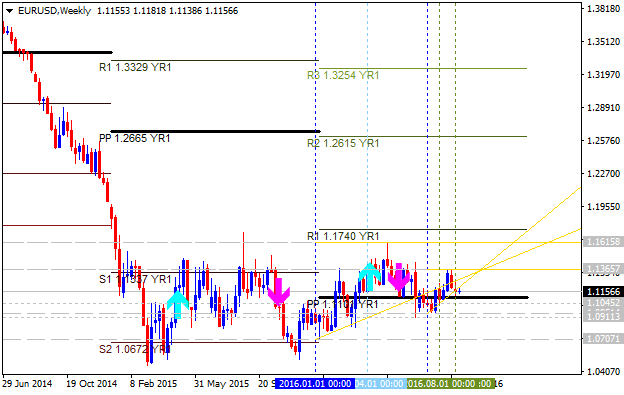
And this level is very close to Central yearly Pivot on W1 chart (1.1101) - and if the price breaks this Central Pivot at 1.1101 to below on weekly close bar so the global bearish reversal will be started for this pair for whole this/next years for example.
Forum on trading, automated trading systems and testing trading strategies
Sergey Golubev, 2016.09.06 16:40
Intra-Day Fundamentals - EUR/USD, AUD/USD and USD/CNH: ISM Non-Manufacturing PMI
2016-09-06 14:00 GMT | [USD - ISM Non-Manufacturing PMI]
- past data is 55.5
- forecast data is 55.4
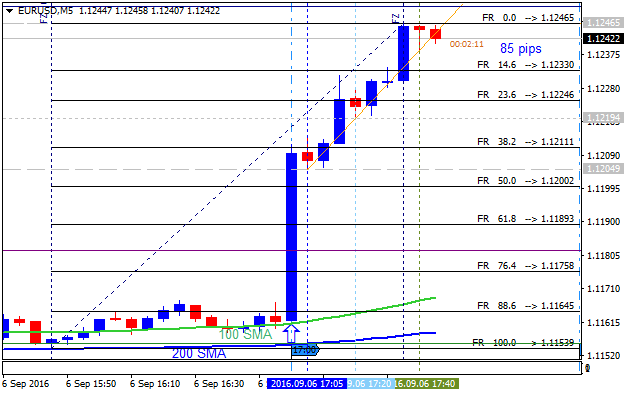
- actual data is 51.4 according to the latest press release
if actual > forecast (or previous one) = good for currency (for USD in our case)
[USD - ISM Non-Manufacturing PMI] = Level of a diffusion index based on surveyed purchasing managers, excluding the manufacturing industry.
==========
"The report was issued today by Anthony Nieves, CPSM, C.P.M., CFPM, chair of the Institute for Supply Management® (ISM®) Non-Manufacturing Business Survey Committee. "The NMI® registered 51.4 percent in August, 4.1 percentage points lower than the July reading of 55.5 percent. This represents continued growth in the non-manufacturing sector at a slower rate. The Non-Manufacturing Business Activity Index decreased substantially to 51.8 percent, 7.5 percentage points lower than the July reading of 59.3 percent, reflecting growth for the 85th consecutive month, at a notably slower rate in August. The New Orders Index registered 51.4 percent, 8.9 percentage points lower than the reading of 60.3 percent in July. The Employment Index decreased 0.7 percentage point in August to 50.7 percent from the July reading of 51.4 percent. The Prices Index decreased 0.1 percentage point from the July reading of 51.9 percent to 51.8 percent, indicating prices increased in August for the fifth consecutive month. According to the NMI®, 11 non-manufacturing industries reported growth in August."
==========
EUR/USD M5: 85 pips price movement by ISM Non-Manufacturing PMI news event
Forum on trading, automated trading systems and testing trading strategies
Sergey Golubev, 2016.09.08 11:32
Trading News Events: European Central Bank Minimum Bid Rate (adapted from the article)
- "Even though the European Central Bank (ECB) is expected to retain the zero-interest rate policy (ZIRP) in September, a string of adjustments to the non-standard measures may trigger a near-term selloff in EUR/USD should the central bank take additional steps to support the monetary union."
- "The ECB may fine-tune its asset-purchases and extend the duration of its quantitative easing (QE) program as the Governing Council struggles to achieve its one and only mandate for price stability, but the euro-dollar stands at risk of facing a similar reaction to the March 10 policy meeting should President Mario Draghi and Co. endorse a wait-and-see approach for monetary policy."
Bullish EUR Trade: Governing Council Sticks with Status Quo
- "Need green, five-minute candle to favor a long EUR/USD trade."
- "Implement same strategy as the bearish euro trade, just in reverse."
- "Need red, five-minute candle following the policy statement to consider a short EUR/USD trade."
- "If market reaction favors a bearish Euro trade, sell EUR/USD with two separate position."
- "Set stop at the near-by swing high/reasonable distance from cost; need at least 1:1 risk-to-reward."
- "Move stop to entry on remaining position once initial target is met, set reasonable limit."
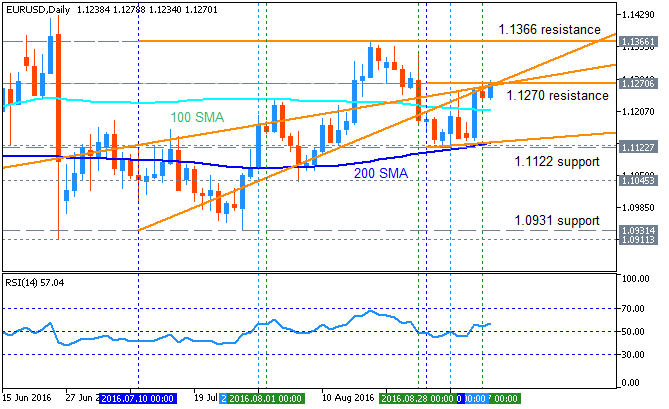
Daily
price
is located above 200-day SMA and near above 100 SMA in the bullish area
of the chart: the price is breaking 1.1270 resistance level on close
daily bar for the bullish trend to be continuing with 1.1366 nearest
bullish target. RSI
indicator is estimating the bullish market condition to be continuing.
- If D1 price breaks 1.1270
resistance level to above on
close daily bar so the primary bullish trend will be continuing.
- If price breaks 1.1122
support on close daily bar to below so the reversal of the price movement from
the ranging bullish to the primary bearish trend will be started.
- If not so the price will be ranging within the levels.
(all images/charts were made using Metatrader 5 software and free indicators from MQL5 CodeBase)
Forum on trading, automated trading systems and testing trading strategies
Sergey Golubev, 2016.09.08 14:02
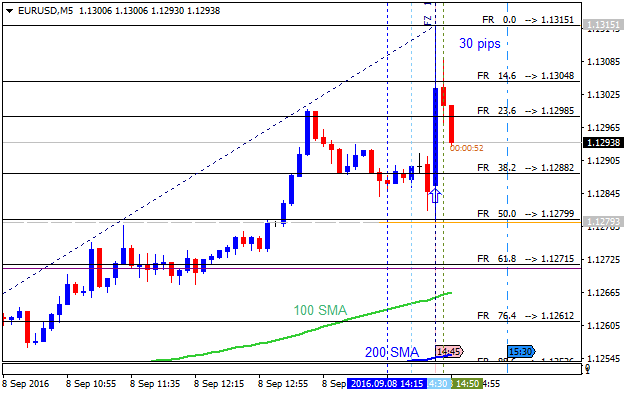
EUR/USD Intra-Day Fundamentals: ECB Minimum Bid Rate and 30 pips range price movement
2016-09-08 11:45 GMT | [EUR - Minimum Bid Rate]
- past data is 0.00%
- forecast data is 0.00%
- actual data is 0.00% according to the latest press release
if actual > forecast (or previous one) = good for currency (for EUR in our case)
[EUR - Minimum Bid Rate] = Interest rate on the main refinancing operations that provide the bulk of liquidity to the banking system.
==========
At today’s meeting the Governing Council of the ECB decided that the interest rate on the main refinancing operations and the interest rates on the marginal lending facility and the deposit facility will remain unchanged at 0.00%, 0.25% and -0.40% respectively. The Governing Council continues to expect the key ECB interest rates to remain at present or lower levels for an extended period of time, and well past the horizon of the net asset purchases.
Regarding non-standard monetary policy measures, the Governing Council confirms that the monthly asset purchases of €80 billion are intended to run until the end of March 2017, or beyond, if necessary, and in any case until it sees a sustained adjustment in the path of inflation consistent with its inflation aim.
==========
EUR/USD M5: 30 pips range price movement by ECB Minimum Bid Rate news event
Forum on trading, automated trading systems and testing trading strategies
Sergey Golubev, 2016.09.08 15:00
Intra-Day Fundamentals - EUR/USD and GBP/USD: U.S. Jobless Claims
2016-09-08 12:30 GMT | [USD - Unemployment Claims]
- past data is 263K
- forecast data is 265K
- actual data is 259K according to the latest press release
if actual < forecast (or previous one) = good for currency (for USD in our case)
[USD - Unemployment Claims] = The number of individuals who filed for unemployment insurance for the first time during the past week.
==========
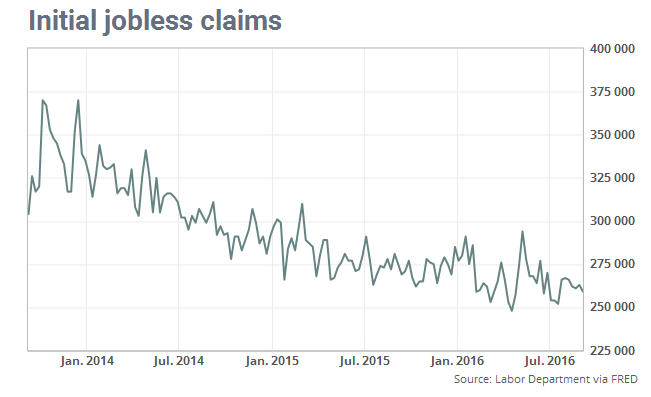
From CNBC article:
The number of Americans filing for unemployment benefits unexpectedly fell last week, pointing to sustained labor market strength even as the pace of job growth is slowing.
Initial claims for state unemployment benefits decreased 4,000 to a seasonally adjusted 259,000 for the week ended Sept. 3, the lowest level since mid-July, the Labor Department said on Thursday. Claims for the prior week were unrevised.
Economists polled by Reuters had forecast first-time applications for jobless benefits rising to 265,000 in the latest week.
It was the 79th straight week that claims remained below the 300,000 threshold, which is associated with robust labor market conditions. That is the longest stretch since 1970, when the labor market was much smaller.
==========
EUR/USD M5: 41 pips price movement by Jobless Claims news event

==========
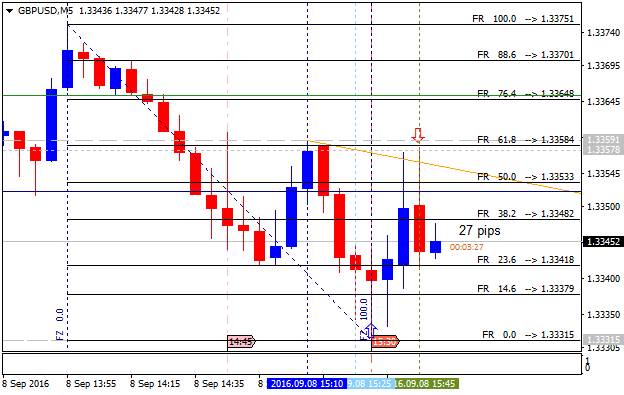
GBP/USD M5: 27 pips range price movement by Jobless Claims news event
Forum on trading, automated trading systems and testing trading strategies
Sergey Golubev, 2016.09.09 14:10
Intra-Day Fundamentals - EUR/USD and FOMC Member Rosengren Speaks
2016-09-09 11:45 GMT | [USD - FOMC Member Rosengren Speaks]
- past data is n/a
- forecast data is n/a
- actual data is n/a according to the latest press release
[USD - FOMC Member Rosengren Speaks] = Speech about economic forecasts at the South Shore Chamber breakfast, in Boston.
==========
Exploring the Economy's Progress and Outlook
==========
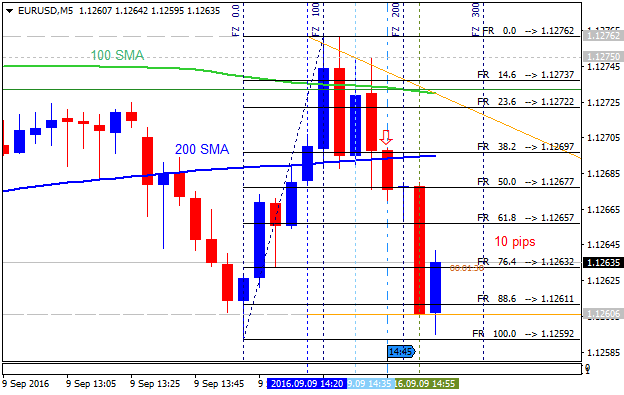
EUR/USD M5: 10 pips price movement by FOMC Member Rosengren Speaks news event
- Free trading apps
- Over 8,000 signals for copying
- Economic news for exploring financial markets
You agree to website policy and terms of use
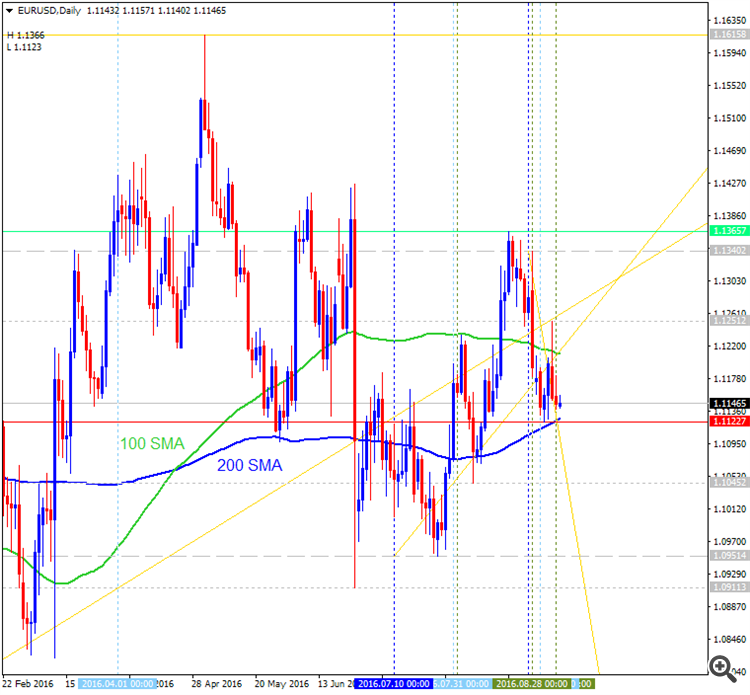

Daily price is located in the bullish area of the chart to be near and above Senkou Span line of Ichimoku indicator on the border between the primary bearish and the primary bullish trend.
- The price is testing 1.1122 support level to below for the bearish reversal to be started.
- Chinkou
Span line of Ichimoku indicator is located near and above the price
indicating the possible breakdown to be started in the near
future.
- Absolute Strength indicator is estimating the bearish reversal.
- Symmetric
triangle pattern was formed by the price, and if the price breaks this
pattern to above together with 1.1365 resistance level so the primary
bullish trend will be resumed.
If D1 price breaks 1.1122 support level on close bar so the reversal of the daily price movement to the primary bearish market condition will be started with 1.0951 lever as a nearest daily target.If D1 price breaks 1.1365 resistance level on close bar from below to above so the bullish trend will be resumed.
If not so the price will be on bullish ranging within 1.1365/1.1122 levels.
SUMMARY : ranging near bearish reversal
TREND : ranging