New daily bar was opened inside Ichimoku cloud which is indicating the ranging market condition for the week. Support/resistance levels are the same ones, for example:
If D1 price breaks 1.1045
support level on close bar together with descending triangle pattern to below so the primary bearish trend will be resumed.
If D1 price breaks 1.1233
resistance level on close bar from below to above so the bullish
reversal will be started.
If not so the price will be on bearish ranging within the levels.
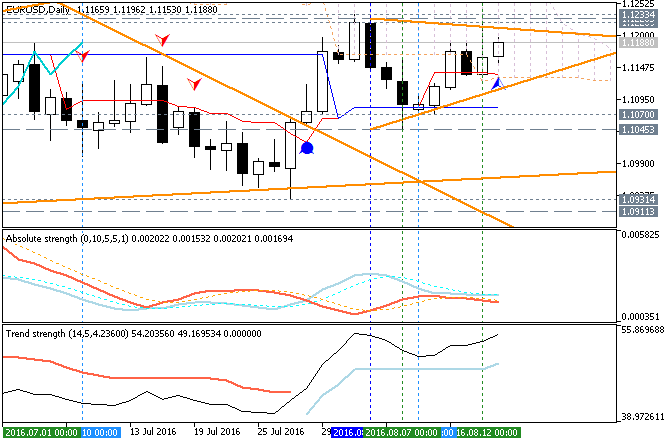
Chinkou Span line of Ichimoku indicator broke the price to above for the possible breakout so the most likely scenarios for the daily price movement for the week are the following:
- ranging inside Ichimoku cloud, or
- 1.1233 resistance level to be broken by the price for the bullish reversal.
Forum on trading, automated trading systems and testing trading strategies
Sergey Golubev, 2016.08.16 10:42
Trading News Events: U.S. Consumer Price Index (CPI) (adapted from the article)
- "Despite forecasts for a downtick in the U.S. Consumer Price Index (CPI), stickiness in the core rate of inflation may boost the appeal of the greenback and spark a near-term pullback in EUR/USD as it puts pressure on the Federal Reserve to raise the benchmark interest rate sooner rather than later."
- "The growing risk of overshooting the 2% inflation-target may spur a larger dissent within Federal Open Market Committee (FOMC), and we may see a growing number of central bank officials push for a 2016 rate-hike especially as the U.S. economy approaches ‘full-employment.’ "
Bullish USD Trade
- "Need red, five-minute candle to favor a short EUR/USD trade."
- "Implement same setup as the bearish dollar trade, just in the opposite direction."
- "Need green, five-minute candle following the print to consider a long position on EUR/USD."
- "If market reaction favors a bearish dollar trade, buy EUR/USD with two separate position."
- "Set stop at the near-by swing low/reasonable distance from entry; look for at least 1:1 risk-to-reward."
- "Move stop to entry on remaining position once initial target is hit; set reasonable limit."
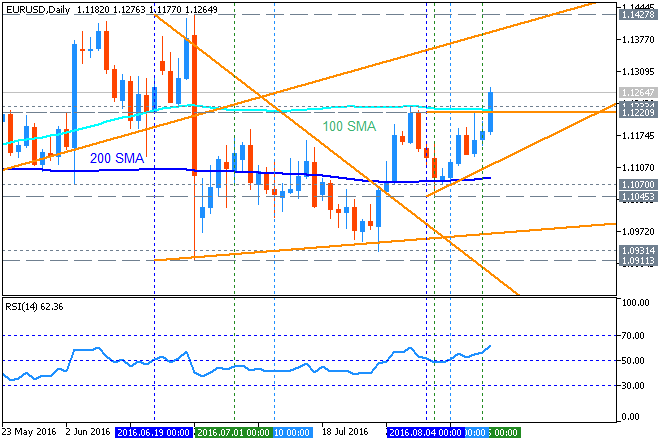
Daily price
is located above 200-day SMA in the bullish area of the chart. The price is breaking 100-day SMA to above from the ranging area to the bullish trend to be resumed. RSI
indicator is estimating the bullish market condition to be continuing.
- If D1 price breaks 1.1220 resistance level together with ascending triangle pattern to above on close daily bar so the primary bullish trend will be continuing.
- If price breaks 1.1045
support on close daily bar to below so the reversal of the price movement from
the ranging bullish to the primary bearish trend will be started.
- If not so the price will be ranging within the levels.
Forum on trading, automated trading systems and testing trading strategies
Sergey Golubev, 2016.08.16 15:13
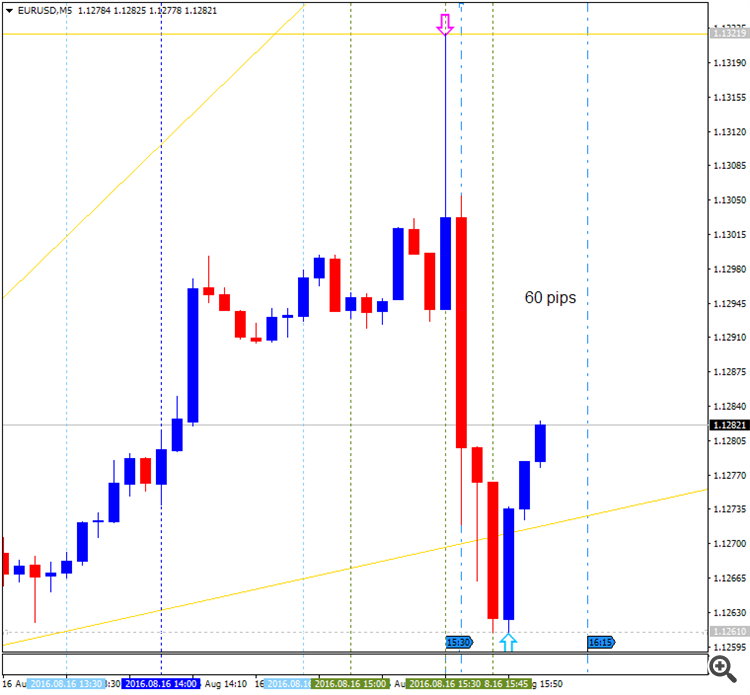
Intra-Day Fundamentals - EUR/USD and GBP/USD: U.S. Consumer Price Index2016-08-16 12:30 GMT | [USD - CPI]
- past data is 0.2%
- forecast data is 0.0%
- actual data is 0.0% according to the latest press release
if actual > forecast (or previous one) = good for currency (for USD in our case)
[USD - CPI] = Change in the price of goods and services purchased by consumers.
==========
- "The Consumer Price Index for All Urban Consumers (CPI-U) was unchanged in July on a seasonally adjusted basis, the U.S. Bureau of Labor Statistics reported today. Over the last 12 months, the all items index rose 0.8 percent before seasonal adjustment."
- "The energy index declined in July and the food index was unchanged. The index for all items less food and energy rose, but posted its smallest increase since March. As a result, the all items index was unchanged after rising in each of the 4 previous months."
- "The energy index fell 1.6 percent after rising in each of the last four months. The decline was due to a sharp decrease in the gasoline index; other energy indexes were mixed. The food at home index declined 0.2 percent as four of the six major grocery store food group indexes decreased, while the index for food away from home rose 0.2 percent."
- "The index for all items less food and energy increased 0.1 percent in July after rising 0.2 percent in June. The shelter index rose 0.2 percent, its smallest increase since March, and the indexes for medical care, new vehicles, and motor vehicle insurance also rose. In contrast, the indexes for airline fares, used cars and trucks, communication, and recreation were among those that declined in July."
==========
EUR/USD M5: 60 pips range price movement by U.S. Consumer Price Index news event
Forum on trading, automated trading systems and testing trading strategies
Sergey Golubev, 2016.08.17 20:20
Intra-Day Fundamentals - EUR/USD and GBP/USD: FOMC Meeting Minutes
2016-08-17 18:00 GMT | [USD - FOMC Meeting Minutes]
- past data is n/a
- forecast data is n/a
- actual data is n/a according to the latest press release
[USD - FOMC Meeting Minutes] = It's a detailed record of the FOMC's most recent meeting, providing in-depth insights into the economic and financial conditions that influenced their vote on where to set interest rates.
==========
Fed minutes: Some FOMC voters thought a rate hike may be needed soon (based on CNBC article)
- "Some voting Federal Reserve policymakers expect that a U.S. interest rate increase will be needed soon, although there is general agreement that more data is needed before such a move, according to the minutes from the Fed's July policy meeting."
- "Some ... members anticipated that economic conditions would soon warrant taking another step in removing policy accommodation," the Fed said in the minutes, which were released on Wednesday."
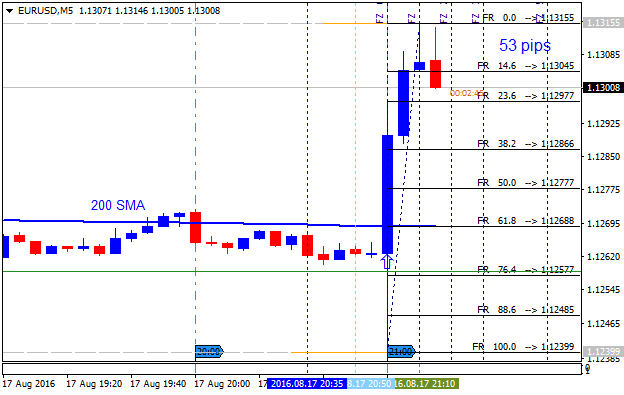
- "After the release of the minutes, the U.S. dollar hit a session low against the yen at about 100.15 yen. The euro touched a session high against the dollar of about $1.1295."
==========
EUR/USD M5: 53 pips range price movement by FOMC Meeting Minutes news event
==========
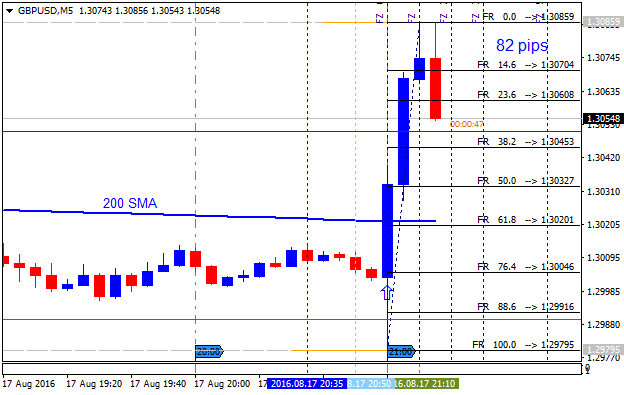
GBP/USD M5: 82 pips range price movement by FOMC Meeting Minutes news event
Forum on trading, automated trading systems and testing trading strategies
Sergey Golubev, 2016.08.18 14:53
Intra-Day Fundamentals - EUR/USD and GBP/USD: Philadelphia Fed Business Outlook Survey
2016-08-18 12:30 GMT | [USD - Philly Fed Manufacturing Index]
- past data is -2.9
- forecast data is 1.4
- actual data is 2.0 according to the latest press release
if actual > forecast (or previous one) = good for currency (for USD in our case)
[USD - Philly Fed Manufacturing Index] = Level of a diffusion index based on surveyed manufacturers in Philadelphia.
==========

==========
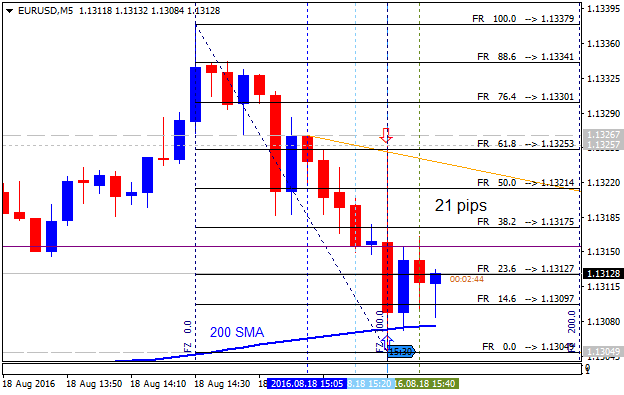
EUR/USD M5: 21 pips range price movement by Philadelphia Fed Business Outlook Survey news event
==========
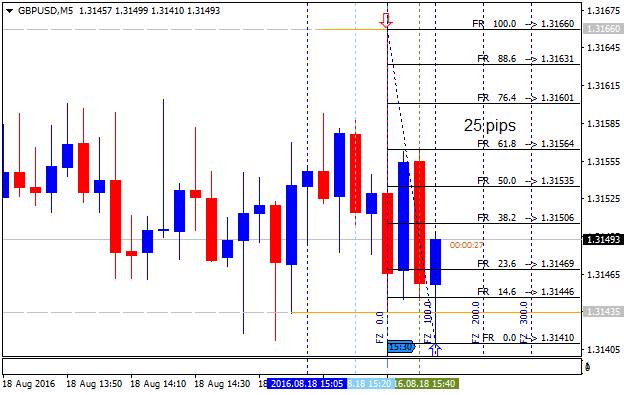
GBP/USD M5: 25 pips range price movement by Philadelphia Fed Business Outlook Survey news event
Forum on trading, automated trading systems and testing trading strategies
Sergey Golubev, 2016.08.19 09:50
Technical Targets for EUR/USD by United Overseas Bank (based on the article)
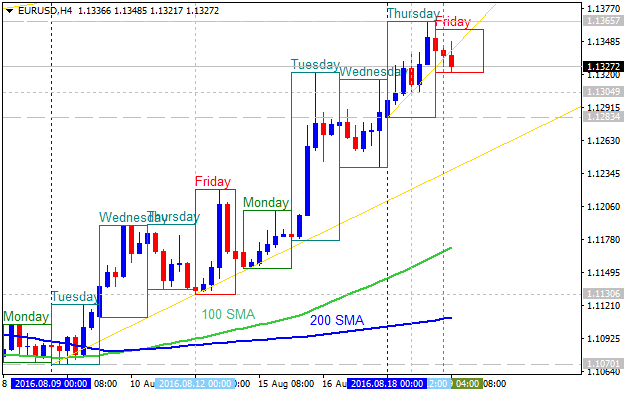
H4 price
is located above 100 SMA/200 SMA for the bullish market condition: the price was bounced from 1.1365 resistance level for the ranging to be started within
the following support/resistance
levels:
- 1.1365 resistance level located above 100 SMA/100 SMA in the bullish trend to be continuing, and
- 1.1283 support level located in the beginning fo the secondary correction to be started.
The
bearish reversal level is 1.1130 support, and if the price breaks this
level to below on close H4 bar so the reversal of the intra-day price
movement from the bullish to the primary bearish market condition will
be started.
Daily
price. United Overseas Bank is expecting for EUR/USD to be continuing with the bullish trend up to 1.1430/35 level as the target:
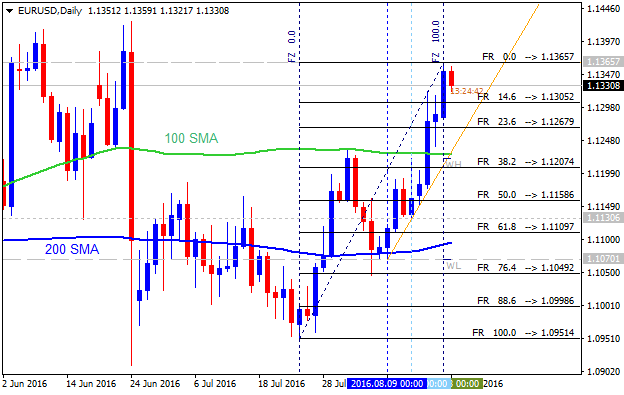
- If daily price breaks 1.1365 resistance level
on close bar so the bullish trend will be resumed.
- If daily price breaks 1.1267 support level on close bar so the local downtrend as the secondary correction will be started
- If not so the price will be ranging within the levels.
- Free trading apps
- Over 8,000 signals for copying
- Economic news for exploring financial markets
You agree to website policy and terms of use

Daily price broke one of the 'reversal' Senkou Span line of Ichimoku indicator together with trendline to above: the price broke this line to be located inside Ichimoku cloud in the bearish ranging area of the chart waiting for the direction. Absolute Strength indicator is estimating the trend to be on ranging waiting for breakout/breakdown, and Trend Strength inticator is evaluating the future possible trend as the possible daily bullish reversal.
If D1 price breaks 1.1045 support level on close bar together with descending triangle pattern to below so the primary bearish trend will be resumed.
If D1 price breaks 1.1233 resistance level on close bar from below to above so the bullish reversal will be started.
If not so the price will be on bearish ranging within the levels.
SUMMARY : ranging bearish
TREND : bearish