Forum on trading, automated trading systems and testing trading strategies
Sergey Golubev, 2016.07.06 08:55
USD/CAD Technical Analysis - daily bearish ranging near 200-day SMA reversal area (adapted from the article)
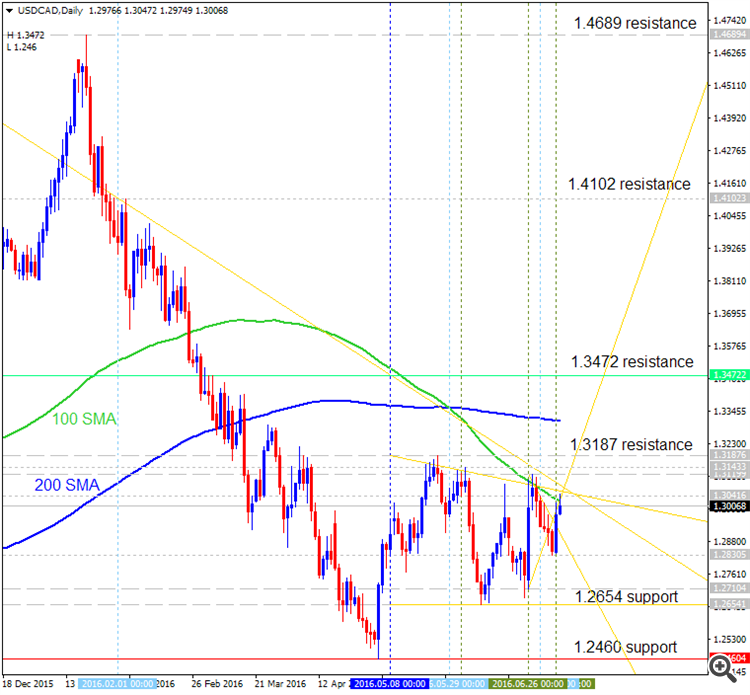
Daily price is located near and below SMA with period 200 (200 SMA) in the bearish area of the chart for the ranging within 1.3472 "bullish reversal" resistance level and 1.2654 "bearish continuation" support level:
- "USD/CAD looks to be breaking out of a period of consolidation as the US Dollar’s strength may resume. In such a case, we’d expect to see an aggressive move higher toward the 38.2-61.8% Fibonacci Retracement of the January 20-May 3 Range, which could push USD/CAD up to ~1.3307-1.3832."
- "Therefore, if USD/CAD will resume a Bull-Run, a break above 1.3028/3187 will be the first indication that we could be on our way to multi-100 pip rally. After the trading 1.3187 in late May, the price has found support a few hundred pips lower around ~1.2650."
- "For now, 1.2650 is key support, and until that level is broken, either consolidation or waiting for a breakout higher will remain in focus. Tighter levels of support can be found at the Weekly Pivot at 1.2920 and the 61.8% of the Thursday-Monday range post-Brexit at 1.2845. However, these levels are likely more beneficial for shorter-term that are looking for shorter-term levels for intraday opportunities."
If the price will break 1.3472 resistance level so the reversal of the daily price movement to the primary bullish market condition will be started.
If price will break 1.2654 support so the bearish trend will be continuing.
If not so the price will be on bearish ranging within the levels.
| Resistance | Support |
|---|---|
| 1.3187 | 1.2654 |
| 1.3472 | 1.2460 |
- Recommendation to go short: watch the price to break 1.2654 support level for possible sell trade
- Recommendation to go long: watch the price to break 1.3472 resistance level for possible buy trade
- Trading Summary: ranging
SUMMARY : ranging
Forum on trading, automated trading systems and testing trading strategies
Sergey Golubev, 2016.07.06 15:35
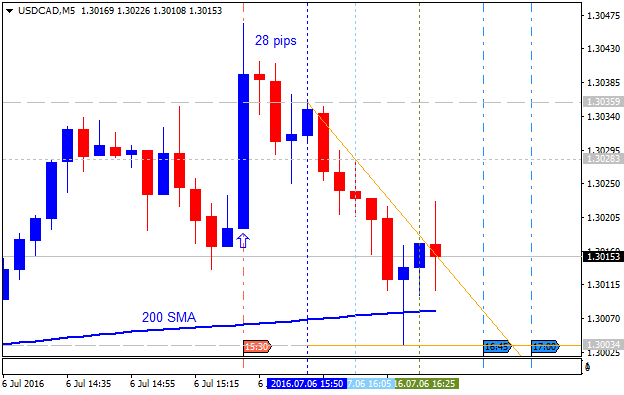
USD/CAD Intra-Day Fundamentals: Canadian Trade Balance and 28 pips price movement
2016-07-06 12:30 GMT | [CAD - International Merchandise Trade]
- past data is -3.3B
- forecast data is -2.6B
- actual data is -3.3B according to the latest press release
if actual > forecast (or previous one) = good for currency (for CAD in our case)
[CAD - International Merchandise Trade] = Difference in value between imported and exported goods during the reported month.
==========
"Canada's exports fell 0.7% to $41.1 billion in May. Export volumes declined 2.3% and prices were up 1.6%. Imports decreased 0.8% to $44.4 billion, as volumes were down 0.9% and prices edged up 0.2%. As a result, Canada's merchandise trade deficit with the world in May was virtually unchanged compared with April at $3.3 billion."==========
USD/CAD M5: 28 pips price movement by Canadian Trade Balance news event :

Forum on trading, automated trading systems and testing trading strategies
Sergey Golubev, 2016.07.08 14:48
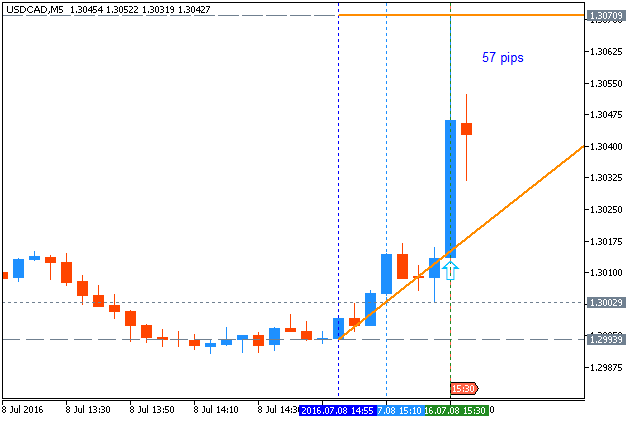
USD/CAD Intra-Day Fundamentals: Canada's Employment Change and 57 pips price movement
2016-07-08 12:30 GMT | [CAD - Employment Change]
- past data is 13.8K
- forecast data is 6.5K
- actual data is -0.7K according to the latest press release
if actual > forecast (or previous one) = good for currency (for CAD in our case)
[CAD - Employment Change] = Change in the number of employed people during the previous month.
==========
"Employment was unchanged in June (0.0%). The unemployment rate declined 0.1 percentage points to 6.8%, as the number of people searching for work edged down. In the second quarter of 2016, employment was little changed (+11,000 or +0.1%). This was the smallest quarterly change in employment in two years."
==========
USD/CAD M5: 57 pips price movement by Canada's Employment Change news event :

- Free trading apps
- Over 8,000 signals for copying
- Economic news for exploring financial markets
You agree to website policy and terms of use

Daily price is on breakdown for the Ichimoku cloud to be crossed to below on open daily bar for the reversal of the price movement to the primary bearish market condition: the price is breaking 1.2864 support level for now for the bearish breakdown to be continuing and with 1.2654 level as a daily bearish target.
If D1 price breaks 1.2864 support level on close bar so the bearish trend will be started.
If not so the price will be on bullish ranging within between Senkou Span line of Ichimoku cloud and 1.3119 resistance level located in the bullish area of the chart.
SUMMARY : possible breakdown
TREND : daily bearish reversal