Forum on trading, automated trading systems and testing trading strategies
Sergey Golubev, 2016.07.04 12:58
GBP/USD Intra-Day Fundamentals: U.K. Construction PMI and 44 pips range price movement
2016-07-04 08:30 GMT | [GBP - Construction PMI]
- past data is 51.2
- forecast data is 50.7
- actual data is 46.0 according to the latest press release
if actual > forecast (or previous one) = good for currency (for GBP in our case)
[GBP - Construction PMI] = Level of a diffusion index based on surveyed purchasing managers in the construction industry.
==========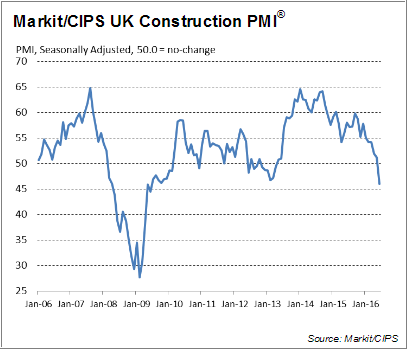
"At 46.0 in June, down from 51.2 in May, the seasonally adjusted Markit/CIPS UK Construction Purchasing Managers’ Index® (PMI®) dropped below the neutral 50.0 threshold for the first time since April 2013. The latest reading pointed to the weakest overall performance for exactly seven years, but the rate of contraction was much slower than seen during the 2008/09 downturn."
==========
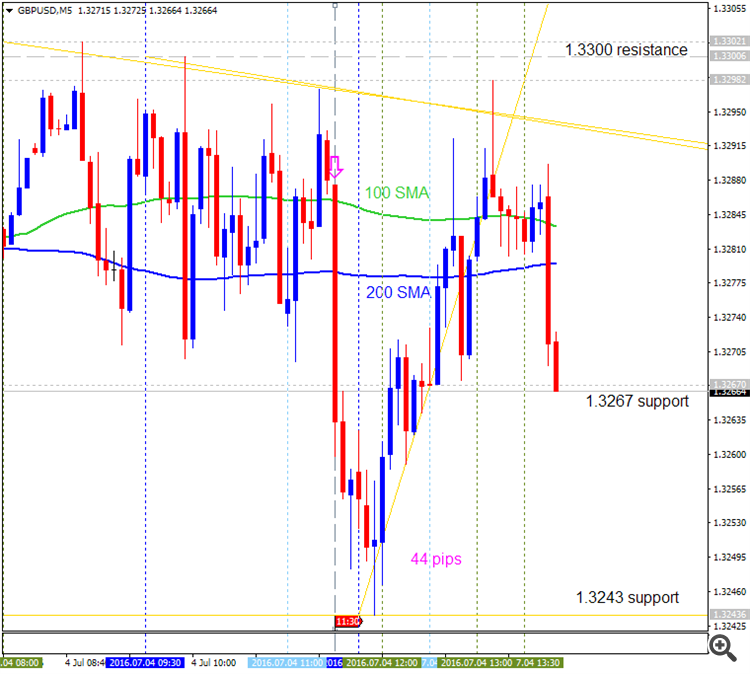
GBP/USD M5: 44 pips range price movement by U.K. Construction PMI news event :
M5 intra-day price broke 100 SMA/200 SMA to below for the primary bearish breakdown: the price made 44 pips to below and it was bounced from 1.3243 support level to above for the ranging condition within 100 SMA/200 SMA ranging area.
If the price breaks 1.3243 support level to below on close M5 bar so the primary bearish trend will be continuing.
If the price breaks 1.3300 resistance level to above on close M5 bar so the reversal to the primary bullish will be started on this timeframe.
If not so the price will be on ranging within the levels waiting for direction.
Forum on trading, automated trading systems and testing trading strategies
Sergey Golubev, 2016.07.05 09:48
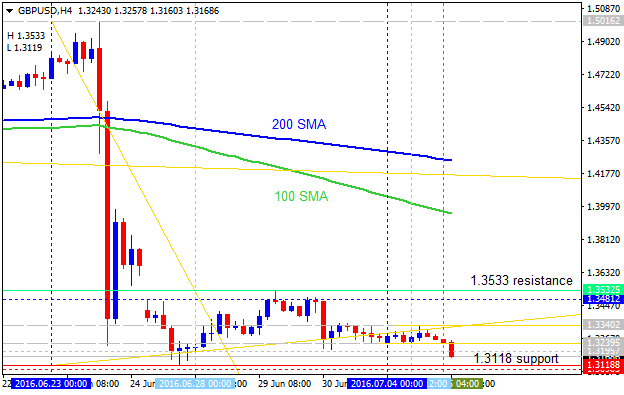
Technical Targets for GBP/USD by United Overseas Bank (based on the article)H4 price
is located below 200
period SMA (200 SMA) for the bearish area of the chart for the ranging within narrow support/resistance levels:
- 1.3533 resistance level located below 200 SMA in the beginning of the secondary bear market rally to be started, and
- 1.3118 support level located far below 100 SMA/200 SMA in the beginning of the bearish trend to be resumed after ranging.
Daily
price. United Overseas Bank is considering for GBP/USD to be on the
bearish market condition with 1.3000 key psy support level:
"GBP spent another day trading in a relatively narrow range and the
strong downward momentum after Brexit is showing further signs of
slowing. That said, another leg lower to the 1.3000 target cannot be
ruled out just yet."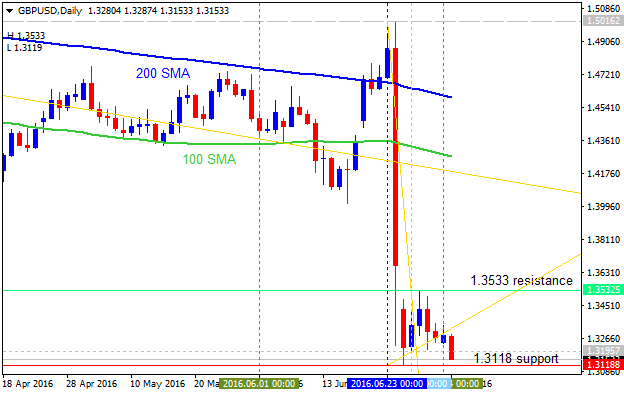
- If daily price breaks 1.3533 resistance level
on close bar so the local uptrend as a bear market rally will be started.
- If daily price breaks 1.3118 support level on close bar so the primary bearish trend will be continuing with 1.3000 level as a possible bearish target.
- If not so the price will be ranging within the levels.
Forum on trading, automated trading systems and testing trading strategies
Charles Odemero, 2016.07.06 09:20
How safe is it to trade GBPUSD since the pound has crashed to a 30 year low?Forum on trading, automated trading systems and testing trading strategies
Forecast for Q3'16 - levels for GBP/USD
Mirza Baig, 2016.07.06 09:33
It is still showing volatility. It just dropped almost 250 pips, hit a low of 1.27927 and now retracing, currently trading at 1.29890Yes, if we look at M5 timeframe so the price was bounced from 1.2795 support level for the bear market rally to be reversed back to the bullish market condition by 200 SMA (blue line on the chart) breaking to above:

For H4 intra-day - the price is on bearish ranging within narrow s/r levels and still was not recovered after 'brexit breakdown' for example:
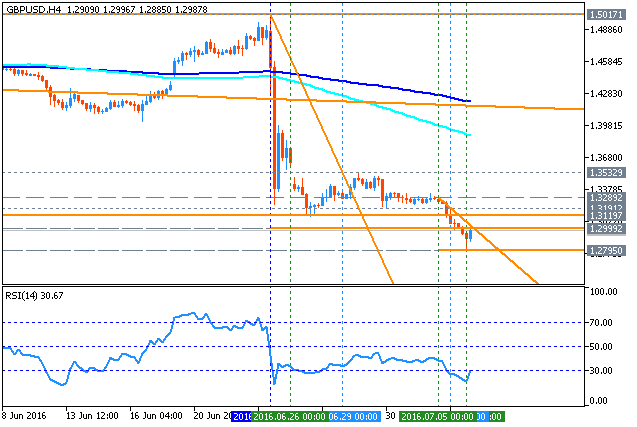
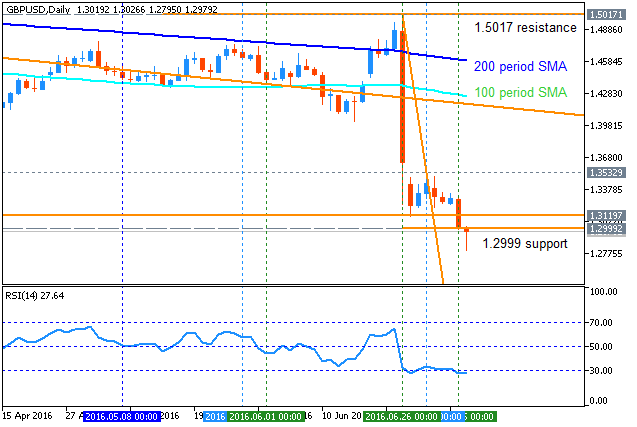
And the daily price is still playing "Brexit game": the price is on bearish breakdown by 1.2999 support level to be crossing to below for the bearish breakdown to be continuing.
Forum on trading, automated trading systems and testing trading strategies
Sergey Golubev, 2016.07.08 09:43
Technical Targets for GBP/USD by United Overseas Bank (based on the article)
H4 price
is located below Ichimoku cloud for the bearish ranging within narrow support/resistance levels:
- 1.3119 resistance level located on the border between the ranging bearish and the bear market rally, and
- 1.2795 support level located far below Ichimoku cloud in the bearish area of the chart.
Absolute Strength indicator together with Chinkou Span line are estimating the ranging condition to be continuing in the near future, and Trend Strength indicator is showing the possible rally to be started within the bearish trend for example.

Daily
price. United Overseas Bank is considering for GBP/USD to be on the
bearish market condition with 1.2700 as a possible bearish target with 1.3150 stop loss for example:

- If daily price breaks 1.3532 resistance level
on close bar so the local uptrend as a bear market rally will be started.
- If daily price breaks 1.2795 support level on close bar so the primary bearish trend will be continuing.
- If not so the price will be ranging within the levels.
Forum on trading, automated trading systems and testing trading strategies
Sergey Golubev, 2016.07.12 11:30
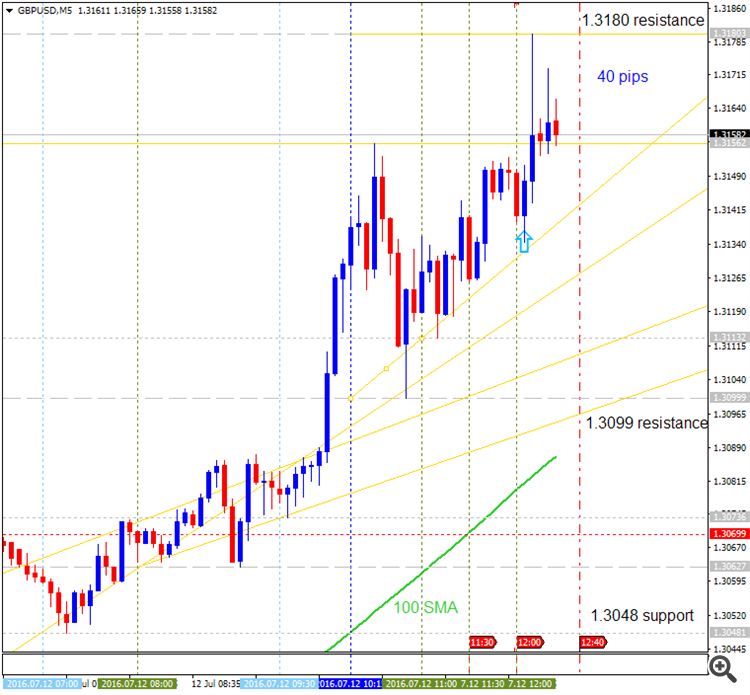
GBP/USD Intra-Day Fundamentals: BoE Financial Stability Report speech and 40 pips price movement
2016-07-12 09:00 GMT | [GBP - BoE Gov Carney Speaks]
- past data is n/a
- forecast data is n/a
- actual data is n/a according to the latest press release
[GBP - BoE Gov Carney Speaks] = The speech about the Bank of England Financial Stability Report before the Treasury Select Committee, in London.
==========
GBP/USD M5: 40 pips price movement by BoE Financial Stability Report speech news event :
M5 price is located to be above 100 period SMA (100 SMA) and 200 period SMA (200 SMA) in the bullish area of the chart. The price is testing 1.3180 resistance level to above by BoE Financial Stability Report speech now. Alternative, if M5 price breaks 1.3048 support level to below so the bearish reversal of the intra-day price movement will be started. By the way, the most likely scenario for the price in the near future is the M5 bullish ranging market condition within key s/r levels.
If M5 price breaks 1.3180 resistance level to above on close bar so the primary bullish trend will be continuing.
If M5 price breaks 1.3048 support level to below on close bar so the bearish reversal will be started.
If not so the price will be on bullish ranging within the levels.
Forum on trading, automated trading systems and testing trading strategies
Sergey Golubev, 2016.07.12 15:53
How low can sterling go? (review of the article)
There are some forecastings made by some int'l financial institutions related to the GBP/USD pair movement in the long-term situation:
- Goldman Sachs: "sterling hit $1.20 within three months."
- Deutsche Bank, Société Générale, UBS, JPMorgan, and HSBC: "price targets ranging from $1.15 to $1.20."
- Allianz: "sterling could even “head to parity” with the dollar."
If we look at the weekly chart so we can see that the price is located too far from 100 SMA/200 SMA area for any possible bullish reversal in this year for example. And if the price breaks 1.2794 to below so the bearish trend will be continuing without ranging up to the new bottom to be formed. So, seems, the key level which should be broken by the price is 1.2794.
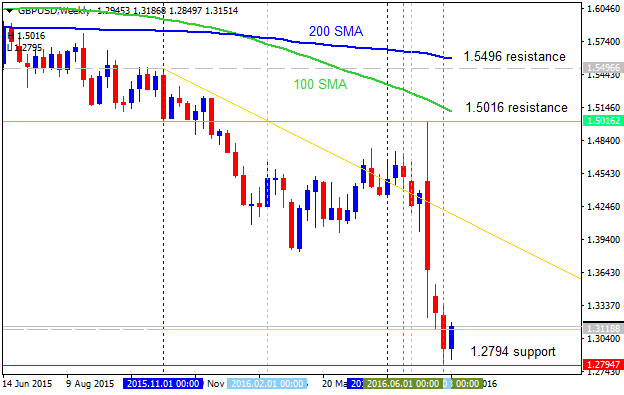
And it is too early to speak about 1.20 or 1.15 levels for now if the key level at 1.2794 is not yet broken to below.
Forum on trading, automated trading systems and testing trading strategies
Sergey Golubev, 2016.07.14 10:23
Trading News Events: BoE Official Bank Rate and Monetary Policy Summary (adapted from the article)
2016-07-14 11:00 GMT | [GBP - Official Bank Rate]
- past data is 0.50%
- forecast data is 0.25%
- actual data is n/a according to the latest press release
if actual > forecast (or previous one) = good for currency (for GBP in our case)
[GBP - Official Bank Rate] = Interest rate at which the BOE lends to financial institutions overnight.
==========
What’s Expected:
Why Is This Event Important:
"With the U.K. positioned to leave the European Union (EU), the BoE may
have little choice but to further support the economy in 2016 as
Governor Mark Carney tries to avoid a recession. A material shift in the
policy outlook is likely to drag on the sterling as interest-rate
expectations falter."
- "The near-term rebound in GBP/USD may unravel amid the failed attempt to
test the monthly opening range, with the British Pound at risk of facing
near-term headwind should the BoE talk up expectations for additional
monetary support."
- "Above expectations: 0.5% to 0.9%: An unexpected higher reading can send the pair below one support line."
- Key Resistance: "1.4880 (50% retracement) to 1.4930 (38.2% expansion)."
- Key Support: "1.2460 (61.8% expansion) to 1.2500 pivot."
- Bearish trade: "Need red, five-minute candle following the rate decision to consider a short GBP/USD trade."
- Bullish trade: "Need green, five-minute candle to favor a long GBP/USD trade."
==========
GBP/USD H1: ranging inside Ichimoku cloud for direction.
The price is on ranging bearish market condition to be located inside Ichimoku cloud and near below Senlou Span line which is the border between the primary bearish and the primary bullish trend on the chart. Price is breaking Senkou Span line to above for the 1.3275 resistance level as a next target for the primary bullish reversal.
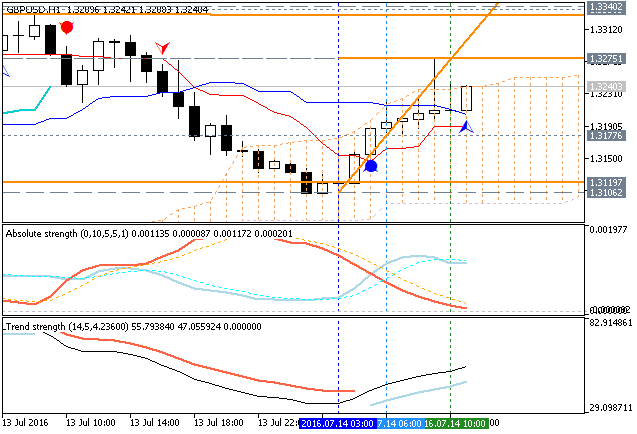
If the price breaks 1.3106 support level to below on close H1 bar so the primary bearish trend will be resumed without ranging up to the new bottom to be formed.
If the price breaks 1.3275 resistance to above on close H1 bar so the reversal of the price movement from the ranging bearish to the primary bullish market condition will be started.
If not so the price will be continuing with the ranging within the levels for direction.
| Resistance | Support |
|---|---|
| 1.3275 | 1.3119 |
| 1.3340 | 1.3106 |
- Free trading apps
- Over 8,000 signals for copying
- Economic news for exploring financial markets
You agree to website policy and terms of use

Technical Targets for GBP/USD
H4 price is on bearish market condition located below 100 SMA/200 SMA reversal area. The price is on ranging within narrow s/r levels: 1.3495 resistance and 1.3120 support. If the price breaks 1.3120 level to below so the intra-day bearish trend will be continuing, if the price breaks 1.3495 resistance to above so the local uptrend as the bear market rally will be started, otherwise - the price will be on bearish ranging within the levels.
Daily price broke 200 SMA to below on Friday to be reversed to the primary bearish condition. The price is testing 1.3120 support level for the bearish trend to be continuing.