BUG - trendindicator not visible after attached to chart
What do you mean?
What do you mean?
I mean,
assume your backtest period is from jan 2002 to jan 2003 and you have historical data from 1998-2012, then after backtest, the chart windows (which shows your orders),
open in the whole available range 1998-2012 -> if you like to see your trades, it is like searching the needle in the haystack...
What is your answer got to do with your first question - attaching TEMA ?
PS : we know your other 3 topics, but stick with this topic please.
What is your answer got to do with your first question - attaching TEMA ?
PS : we know your other 3 topics, but stick with this topic please.
sorry, yes, replied to to wrong thread.
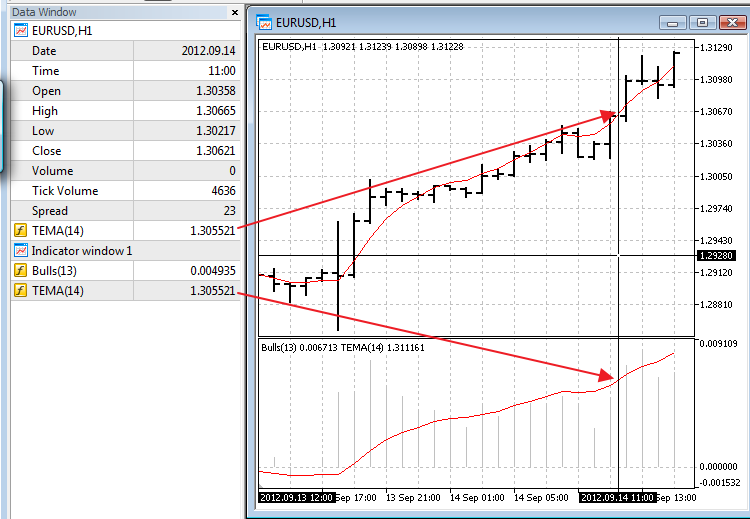
OK, EMA: attached to chart, you can't see it. Normally it should be opened in extra windows, right the way rosh pointed to.
In my case, it was attached to chart windows and was not visible (of course, as values out of visible range)
sorry, yes, replied to to wrong thread.
OK, EMA: attached to chart, you can't see it. Normally it should be opened in extra windows, right the way rosh pointed to.
In my case, it was attached to chart windows and was not visible (of course, as values out of visible range)
- Free trading apps
- Over 8,000 signals for copying
- Economic news for exploring financial markets
You agree to website policy and terms of use
Hello MetaQuotes,
when trying to add triple EMA to chart, this EMA is not visible as it is always added to chart window instead to open extra data window.
No way to change it. (This chart already has 1 indicator in data window).
Another chart shows triple EMA correctly in extra data window