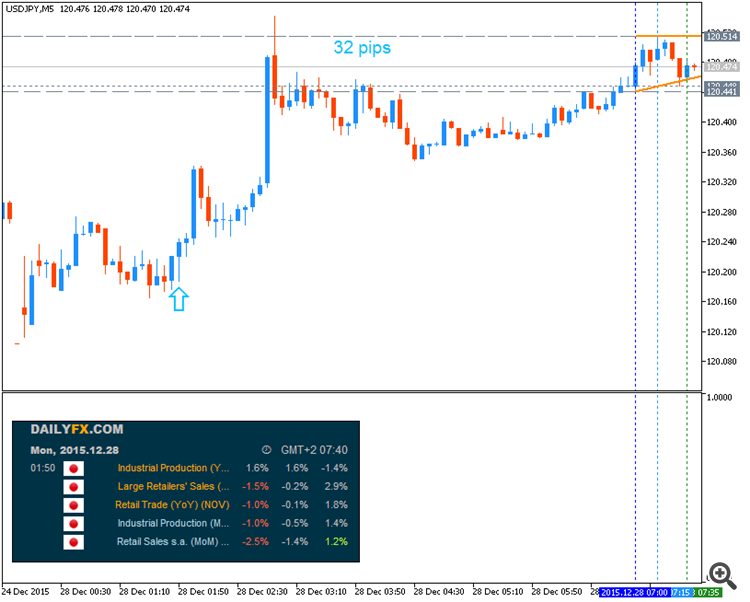
USD/JPY Intra-Day Fundamentals - Retail Sales and 32 pips price movement
2015-12-27 23:50 GMT | [JPY - Retail Sales]
- past data is 1.8%
- forecast data is -0.1%
- actual data is -1.0% according to the latest press release
if actual > forecast (or previous one) = good for currency (for JPY in our case)
[JPY - Retail Sales] = Change in the total value of sales at the retail level==========
USDJPY M5: 32 pips price movement by JPY - Retail Sales news event :
Forum on trading, automated trading systems and testing trading strategies
Sergey Golubev, 2016.01.03 13:06
USDJPY Price Forecast Q1 2016 (based on the article)
- "With the Federal Reserve removing the zero-interest rate policy (ZIRP) in 2015, the normalization cycle in the U.S. accompanied by the quantitative/qualitative easing (QQE) program in Japan may fuel a bullish outlook for USD/JPY amid the deviating paths for monetary policy."
- "The current course for monetary policy in the U.S. and Japan may produce a further advance in USD/JPY over the coming months, and the pair may continue to retrace the decline from back in 2002 as the Fed gears up to remove the emergency measures throughout the year ahead. However, a more delayed normalization cycle in the U.S. paired with a material shift in the BoJ’s stance may produce range-bound conditions during the first three-months of 2016 as market participants gauge the prospects for future policy."
- "Trading wise, price action since December 2014 would complete a head and shoulders top on a drop below 115.57 and yield a target zone of 105.30-106.50. The target zone would be ‘in line’ with Elliott wave guidelines that suggest a corrective process terminates near the former 4th wave of one less degree (that zone is 101.07-105.44)."
In summary, 'long term technical observations reveal a potential inflection point in the USD/JPY exchange rate. Trading behavior in 2016 may look quite different from what traders have seen over the last 4 years.'
Forum on trading, automated trading systems and testing trading strategies
Sergey Golubev, 2016.01.13 14:58
Intra-Day Fundamentals - China CGAC Trade Balance and 67 pips price movement for majors
2016-01-13 02:00 GMT | [CNY - CGAC Trade Balance]
- past data is 343B
- forecast data is 339B
- actual data is 382B according to the latest press release
if actual > forecast (or previous one) = good for currency (for CNY in our case)
[CNY - CGAC Trade Balance] = Difference in value between imported and exported goods during the previous month. Export demand/currency demand are directly linked with each other: foreigners buy the domestic currency to pay for the exports.
==========
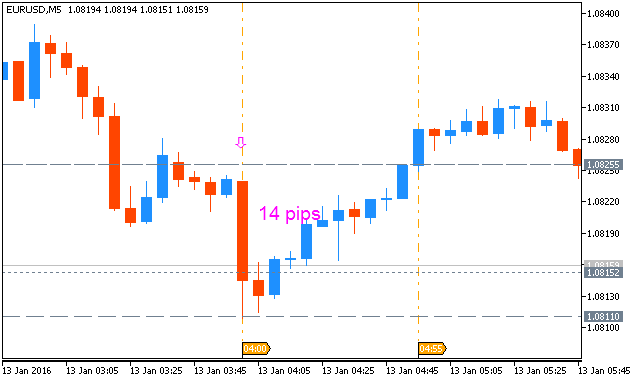
EURUSD M5: 14 pips price movement by CNY - CGAC Trade Balance news event :
==========
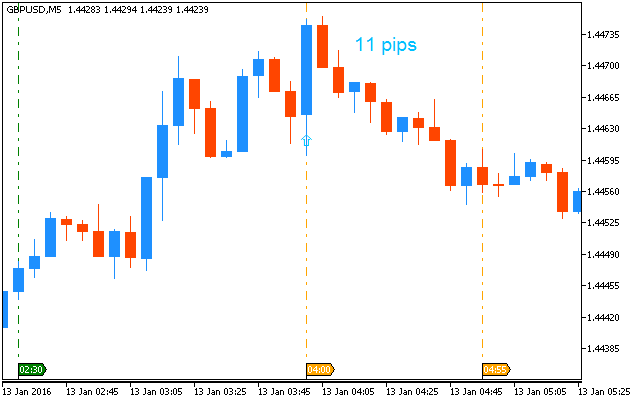
GBPUSD M5: 11 pips price movement by CNY - CGAC Trade Balance news event :
==========
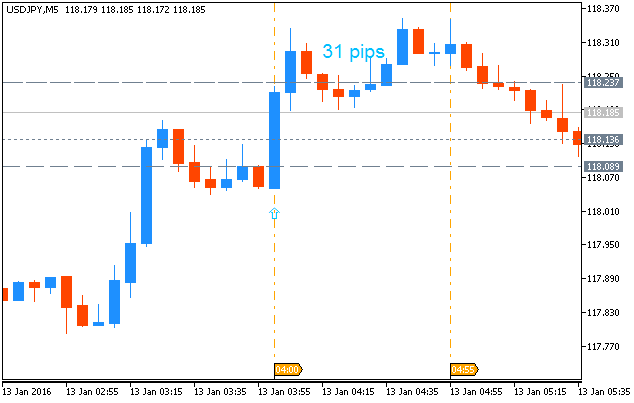
USDJPY M5: 31 pips price movement by CNY - CGAC Trade Balance news event :
==========
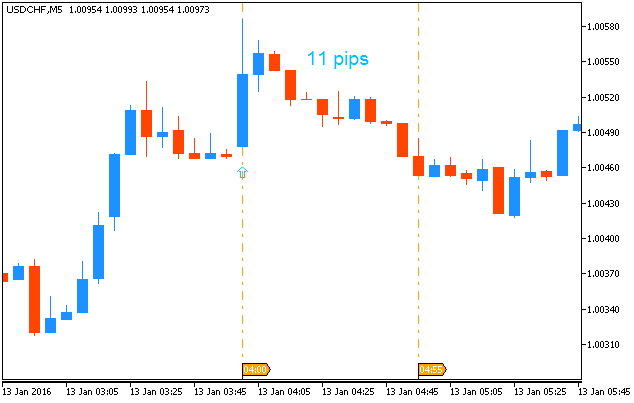
USDCHF M5: 11 pips price movement by CNY - CGAC Trade Balance news event :
Forum on trading, automated trading systems and testing trading strategies
Sergey Golubev, 2016.01.14 10:13
USDJPY Technical Analysis 2016, January 14: ranging bearish (adapted from the article)D1 price is on primary bearish market condition:
- The
price is located to be below Ichimoku cloud/kumo and Senkou Span line
(which is the virtual border between the primary bullish and the
primary
bearish on the daily chart) for the bearish market condition.
- Tenkan-sen
line is below Kijun-sen line of Ichimoku indicator which is indicating
the primary bearish condition to be continuing.
- Chinkou Span line is below the price for the ranging bearish condition.
- "USDJPY weekly chart shows a bearish cloud cross. One of the important bearish signals we discussed in our 13 December report, Technical Advantage: USD/JPY shows signs of weakness, was the pending cross of the Ichimoku cloud. The cross occurred, and the cloud is officially in a bearish position. This happened with RSI breaking support and showing a bearish momentum."
- "USDJPY may trade down to the 100wk moving average and the bottom of the rising cloud at about 114-115.50. Given
the triangle top, a measured move suggests 112 is even a possibility. A
rise to the 50wk average and top of the cloud at about 120.75 would be a
great place to go short, in our view."
- Nearest support levels are 117.22 and 116.13.
- Nearest resistance levels are 118.83 and 123.75.
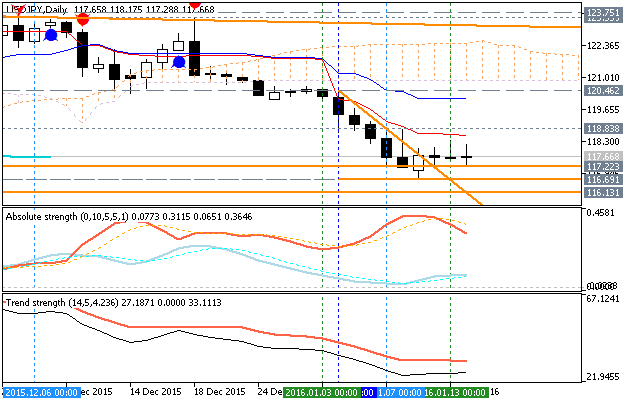
If the price will break 118.83 resistance level so the local uptrend as the bear market rally will be started.
If the price will break 123.75 resistance level so the price will be fully reversed to the bullish market condition with good breakout possibility.
If not so the price will be ranging within the levels.
- Recommendation for long: watch close price to break 118.83 for possible buy trade
- Recommendation
to go short: watch price to break 117.22 support level for possible sell trade
- Trading Summary: bearish
| Resistance | Support |
|---|---|
| 118.83 | 117.22 |
| 123.75 | 116.13 |
SUMMARY : bearish
TREND : breakdown of support levels
USDJPY Technical Analysis 2016, 17.01 - 24.01: daily bearish breakdown to be continuing
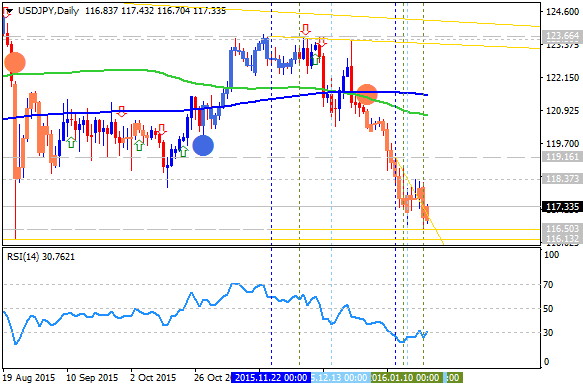
Daily price was on the bearish breakdown: price crossed key support levels together with 100 day SMA/200 day SMA, and it was stopped by 116.13 support level to be started with the ranging within 116.13/119.16 ranging area.
RSI indicator is estimating the ranging bearish condition to be continuing in the near future.If D1 price will break 116.13
support level on close bar so the bearish breakdown to be continuing.
If D1 price will break 119.16
resistance level on close bar so we may see the local uptrend as the bear market rally within the primary bearish condition.
If D1 price will break 123.66
resistance level on close bar so the price will be reversed to the primary bullish trend.
If not so the price will be on ranging within the levels.
- Recommendation for long: watch close D1 price to break 119.16 for possible buy trade
- Recommendation
to go short: watch D1 price to break 116.13 support level for possible sell trade
- Trading Summary: correction to bearish reversal
| Resistance | Support |
|---|---|
| 119.16 | 116.13 |
| 123.66 | N/A |

SUMMARY : bearish breakdown
Forum on trading, automated trading systems and testing trading strategies
Sergey Golubev, 2016.01.19 08:51
USD/JPY Intra-Day Fundamentals: China Gross Domestic Product and 27 pips range price movement
2016-01-19 02:00 GMT | [CNY - GDP]
- past data is 6.9%
- forecast data is 6.9%
- actual data is 6.8% according to the latest press release
if actual > forecast (or previous one) = good for currency (for CNY in our case)
[CNY - GDP] = Change in the inflation-adjusted value of all goods and services produced by the economy.
==========
USDJPY M5: 27 pips range price movement by CNY - GDP news event :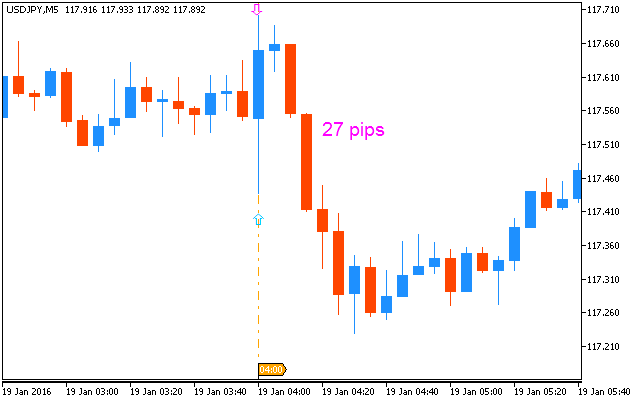
Forum on trading, automated trading systems and testing trading strategies
Market Condition Evaluation based on standard indicators in Metatrader 5
Sergey Golubev, 2016.01.19 16:48
Forecast for Tomorrow: intra-day levels for USD/CAD, EUR/USD, USD/JPY
USD/CAD: ranging bullish. This pair is
ranging to be above Ichimoku cloud within key support/resistance levels to be broken for the bullish trend to be continuing or for possible bearish reversal to be started.
- if the price breaks 1.5605 resistance so the primary bullish market condition will be continuing;
- if the price
breaks 1.4431 support level on close H4 bar so the local uptrend as the secondary correction will be started within the primary bullish market condition;
- if the price breaks 1.4218 support level so the reversal of the price movement from the primary bullish to the primary bearish market condition will be started with the secondary ranging: the price will be located inside Ichimoku cloud in this case);
- if not so the price will be moved within the channel.
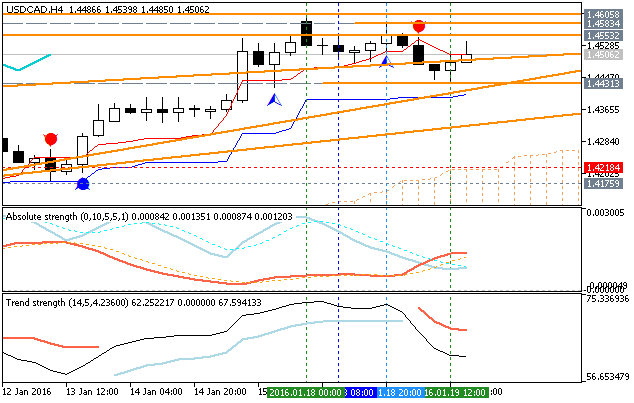
| Resistance | Support |
|---|---|
| 1.5605 | 1.4431 |
| N/A | 1.4218 |
EUR/USD: ranging for direction.
The price for the pair is located above and near Ichimoku cloud for the bullish market condition ranging on the border between the bearish/bullish reversal area waiting for the direction of the trend.
- if the price breaks 1.0984 resistance so the bullish trend will be continuing without secondary ranging condition;
- if the price
breaks 1.0804 support level on close H4 bar so reversal of the price movement from the ranging bullish to the primary bearish condition will be started up to 1.0770 re-enter target;
- if not so the price will be ranging between the levels.
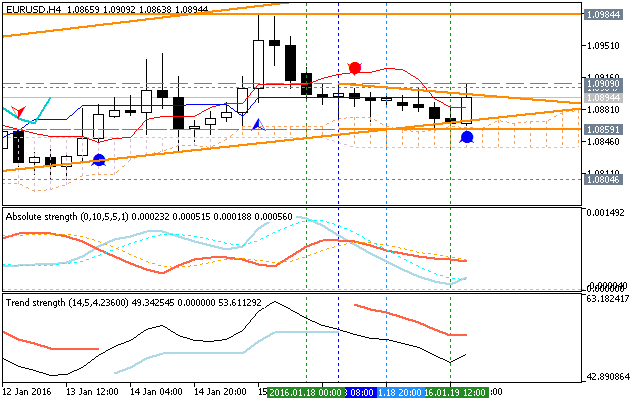
| Resistance | Support |
|---|---|
| 1.0984 | 1.0804 |
| N/A | 1.0770 |
USD/JPY: waiting for big news to start big movement. Intra-day H4 price is located inside Ichimoku cloud and near 'reversal' Senkou Span line (which is the virtual border between the primary bearish and the primary bullish trend on the chart) and with the symmetric triangle pattern which was broken by the price to above for the possible bullish trend to be started.The price is ranging within 118.10/117.00 as intermediate s/r levels and within 118.83/116.50 as the key s/r levels.
- if the price
breaks 118.10 resistance so the primary bullish trend will be continuing up to 118.83 as the next target to re-enter;
- if the price breaks 117.00 support level so the reversal of the price movement to the primary bearish market condition will be started;
- if not so the price will be moved within the levels.
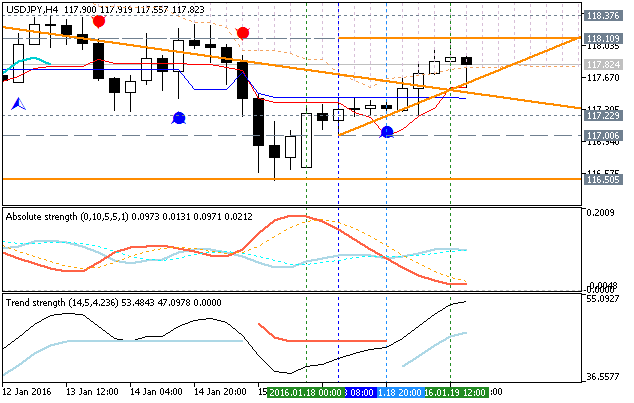
| Resistance | Support |
|---|---|
| 118.10 | 117.00 |
| 118.83 | 116.50 |
Forum on trading, automated trading systems and testing trading strategies
Sergey Golubev, 2016.01.25 09:39
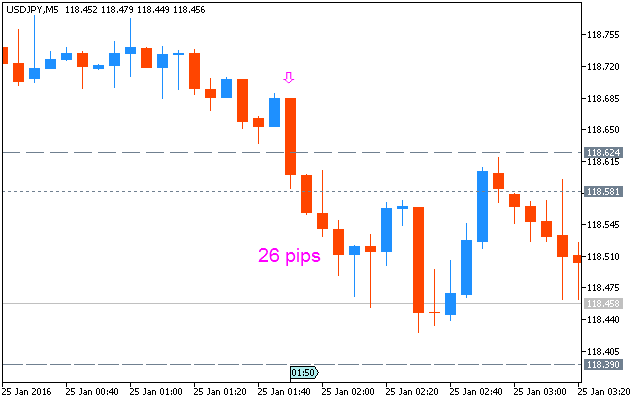
USD/JPY Intra-Day Fundamentals: Trade Balance and 26 pips price movement
2016-01-24 23:50 GMT | [JPY - Trade Balance]
- past data is 0.02T
- forecast data is 0.08T
- actual data is 0.04T according to the latest press release
if actual > forecast (or previous one) = good for currency (for JPY in our case)
[JPY - Trade Balance] = Difference in value between imported and exported goods during the reported month.
==========
USDJPY M5: 26 pips price movement by JPY - Trade Balance news event :
Forum on trading, automated trading systems and testing trading strategies
Sergey Golubev, 2016.01.27 20:32
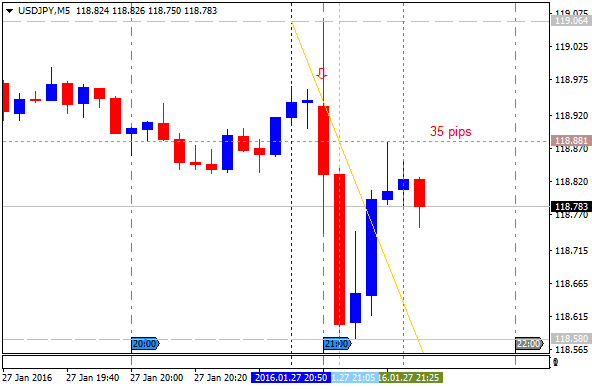
USD/JPY Intra-Day Fundamentals: Federal Funds Rate and 35 pips price movement
2016-01-27 19:00 GMT | [USD - Federal Funds Rate]
- past data is 0.50%
- forecast data is 0.50%
- actual data is 0.50% according to the latest press release
if actual > forecast (or previous one) = good for currency (for USD in our case)
[USD - Federal Funds Rate] = Interest rate at which depository institutions lend balances held at the Federal Reserve to other depository institutions overnight.
==========
"Committee is closely monitoring global economic and financial developments and is assessing their implications for the labor market and inflation, and for the balance of risks to the outlook."
==========
USDJPY M5: 35 pips price movement by Federal Funds Rate news event :
Forum on trading, automated trading systems and testing trading strategies
Sergey Golubev, 2016.01.29 07:30
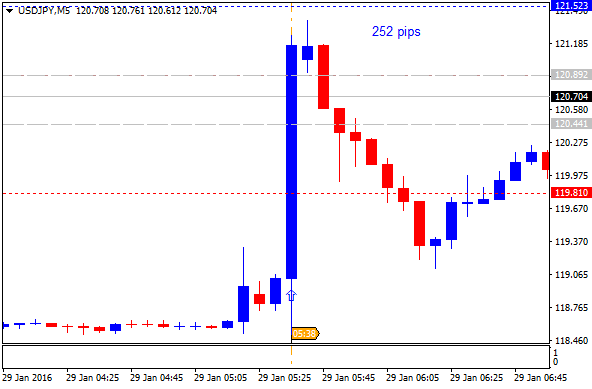
USD/JPY Intra-Day Fundamentals: BOJ Monetary Policy Statement and 252 pips price movement
2016-01-29 03:38 GMT | [JPY - BOJ Monetary Policy Statement]
- past data is ¥80t
- forecast data is n/a
- actual data is ¥80t according to the latest press release
[JPY - BOJ Monetary Policy Statement] = It's among the primary tools the BOJ uses to communicate with investors about monetary policy. It contains the outcome of their decision on asset purchases and commentary about the economic conditions that influenced their decision.
==========
1. The Introduction of "Quantitative and Qualitative Monetary Easing (QQE) with a Negative Interest Rate"- The Bank will apply a negative interest rate of minus 0.1 percent to current accounts that financial institutions hold at the Bank. It will cut the interest rate further into negative territory if judged as necessary.
- The Bank will introduce a multiple-tier system which some central banks in Europe (e.g. the Swiss National Bank) have put in place. Specifically, it will adopt a three-tier system in which the outstanding balance of each financial institution's current account at the Bank will be divided into three tiers, to each of which a positive interest rate, a zero interest rate, or a negative interest rate will be applied, respectively.
- The Bank will lower the short end of the yield curve and will exert further downward pressure on interest rates across the entire yield curve through a combination of a negative interest rate and large-scale purchases of JGBs.
- The Bank will achieve the price stability target of 2 percent at the earliest possible time by making full use of possible measures in terms of the three dimensions.
==========
USDJPY M5: 252 pips price movement by BOJ Monetary Policy Statement news event :
- Free trading apps
- Over 8,000 signals for copying
- Economic news for exploring financial markets
You agree to website policy and terms of use
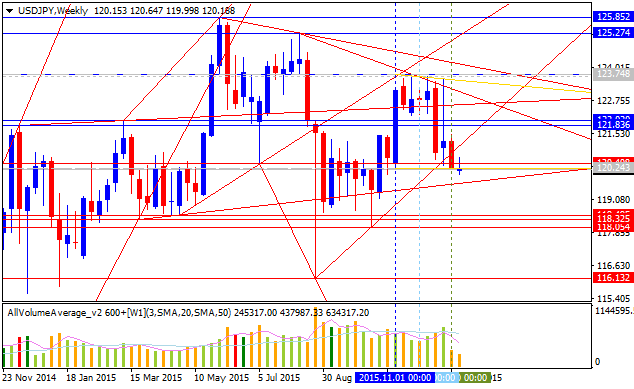
Daily price is on bearish breakdown: the price broke 100 period SMA (100 SMA) and 200 period SMA (200 SMA) from above to below to be reversed from the primary bullish to the primary bearish market condition. The price is breaking Fibo support level at 120.33 to below on daily bar for the bearish breakdown to be continuing with Fibo support at 118.34 as the next bearish target.
There are the following key bullish reversal resistance levels for daily chart:
RSI indicator is estimating the bearish breakdown to be continuing.
Weekly price is on bullish market condition located above 100 period SMA (100 SMA) and above 200 period SMA (200 SMA). The price is ranging within the following key support/resistance levels:
The weekly price came to be very close to break 50.0% Fibo support level at 119.93 to below with 116.13 as the next target.
Monthly price is on bullish condition for the ranging within the following key support/resistance levels:
Descending triangle pattern was formed by the price to be crossed for 100.82 level as the target, and RSI indicator is estomating the local downtrend as the secondary correction to be be started in the near future.