drawing on a candle only, impossible?
I have an offline 2min chart. My goal is to draw a line at the 50% mark of select candles. I seem to be unable to draw anything in the middle of the candle and be the size of the candle. 2 candle's width is the smallest I'm able to draw, or move the lines manually. Any suggestions?
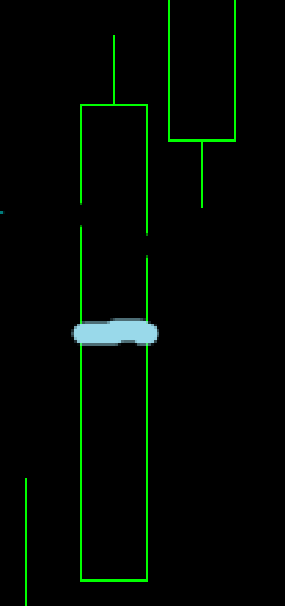
this is the goal
Ok, am i understanding this right? From your description, it appears that you're trying to draw a line at the 50% mark of specific candles. However, there might be an issue with how you're calculating the start and end points of your lines.
Let's correct the calculation of the start and end points first to ensure they are placed at the 50% mark of the candle and have the appropriate width.
Here's the correc way to calculate them.
- startTime and endTime are set to the start time of the current candle and the start time of the next candle, respectively.
- startPrice and endPrice are set to the average of the open and close prices of the current and next candles, respectively, representing the midpoints of the candles.
- midPrice calculates the midpoint between the start and end prices, representing the 50% mark.
The line is created using ObjectCreate with start and end points set to startPrice and endPrice , respectively.
//+------------------------------------------------------------------+
//| Custom indicator iteration function                              |
//+------------------------------------------------------------------+
int OnCalculate(const int rates_total,
                const int prev_calculated,
                const datetime &time[],
                const double &open[],
                const double &high[],
                const double &low[],
                const double &close[],
                const long &tick_volume[],
                const long &volume[],
                const int &spread[])
{
    // Ensure we have enough data
    if (rates_total < 4) return 0; // Need at least 3 candles to compare, plus the current incomplete candle

    int end = rates_total - 2500;
    if (end < 3) end = 3; // Make sure we don't go beyond the 5000 candle limit or have fewer than 3 candles to compare

    // Start from the most recent complete candle and move backward
    for (int i = 1; i <= rates_total; i++) {
        double currentBody = MathAbs(open[i] - close[i]);
        double prevBody1 = MathAbs(open[i+1] - close[i+1]);
        double prevBody2 = MathAbs(open[i+2] - close[i+2]);

        // Check if the current candle has the largest body among the past 3 candles
        if (currentBody > prevBody1 && currentBody > prevBody2) {
            string lineName = "LargestBodyLine_" + IntegerToString(i);
            // Ensure no duplicate object names exist
            if (ObjectFind(0, lineName) != -1) {
                ObjectDelete(0, lineName);
            }

            // Calculate start and end time for the line
            datetime startTime = time[i];
            datetime endTime = time[i+1];

            // Calculate start and end price for the line
            double startPrice = (open[i] + close[i]) / 2;
            double endPrice = (open[i+1] + close[i+1]) / 2;

            // Calculate the 50% level
            double midPrice = (startPrice + endPrice) / 2;

            // Create the line
            ObjectCreate(0, lineName, OBJ_TREND, 0, startTime, startPrice, endTime, endPrice);
            ObjectSetInteger(0, lineName, OBJPROP_COLOR, clrCyan);
            ObjectSetInteger(0, lineName, OBJPROP_STYLE, STYLE_SOLID);
            ObjectSetInteger(0, lineName, OBJPROP_WIDTH, 1);
        }
    }

    return(rates_total);
}

//+------------------------------------------------------------------+
//| Expert deinitialization function                                 |
//+------------------------------------------------------------------+
void OnDeinit(const int reason)
{
    // Loop through all objects and remove those created by the indicator
    for(int i = ObjectsTotal(0, -1, -1) - 1; i >= 0; i--)
    {
        string name = ObjectName(0, i, -1, -1);
        // Check if the object name starts with the prefix used by your indicator's objects
        if(StringFind(name, "LargestBodyLine_") == 0)
        {
            // If it matches, delete the object
            ObjectDelete(0, name);
        }
    }
}
Ok, am i understanding this right? From your description, it appears that you're trying to draw a line at the 50% mark of specific candles. However, there might be an issue with how you're calculating the start and end points of your lines.
Let's correct the calculation of the start and end points first to ensure they are placed at the 50% mark of the candle and have the appropriate width.
Here's the correc way to calculate them.
- startTime and endTime are set to the start time of the current candle and the start time of the next candle, respectively.
- startPrice and endPrice are set to the average of the open and close prices of the current and next candles, respectively, representing the midpoints of the candles.
- midPrice calculates the midpoint between the start and end prices, representing the 50% mark.
The line is created using ObjectCreate with start and end points set to startPrice and endPrice , respectively.
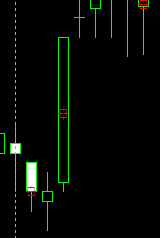
Yes, this is correct. What's odd is even when I try to manually draw a line that only covers one candle, it's impossible. Try it. The closest one can get is goes through the middle of the previous and following candles.
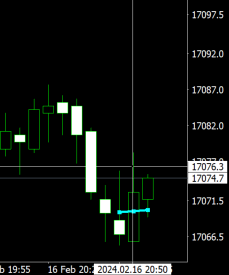
Thanks for giving it a shot, this is what I get when I run the script you suggested.
Yes, this is correct. What's odd is even when I try to manually draw a line that only covers one candle, it's impossible. Try it. The closest one can get is goes through the middle of the previous and following candles.
Thanks for giving it a shot, this is what I get when I run the script you suggested.
ohh now i get what you want, yes i can see, even when i try to do it manually, only for that one candle, i cant. Did you ever think of maybe making it different colors, like half blue and half red or so. i know there is a function (Snap to nearest candle) or something, that can be turned off. I will definitely come back to you on this one.
ObjectSetDouble(0,lineName,OBJPROP_PRICE,midPoint+offset); // Set price
- Free trading apps
- Over 8,000 signals for copying
- Economic news for exploring financial markets
You agree to website policy and terms of use
I have an offline 2min chart. My goal is to draw a line at the 50% mark of select candles. I seem to be unable to draw anything in the middle of the candle and be the size of the candle. 2 candle's width is the smallest I'm able to draw, or move the lines manually. Any suggestions?
this is the goal