Undesired extra chart
does anybody know the answer?
thank you
The extra charts are due to the fact that your code is referencing other time-frames or symbols (most probably via indicators).
So, if you have an "undesired" chart, then it is because your code is calling it. If it is unnecessary, then remove that reference in your code.
Please consider which section is most appropriate — https://www.mql5.com/en/forum/172166/page6#comment_49114893
Thank you Fernando, again, very helpful.
It seems that all my questions I posted recently are related to the fact that I am ---some how--- using another time frame inside the EA code. I checked the indicators, there is no issue there.
So, when I solve that, both questions (plus another that was coming) would be solve. Hence, I now believe that my questions should have been:
- How is the time frame set in an EA code?
- Can I set the time frame without using CExpert or CExpertBase? how?
I suspect that the EA code is forcing to use the time frame from the "Settings" tab by default, because it is not set properly inside the EA code.
This may point to the issue in my code.
thank you
Hi again to all,
Now that I solved the issue with the timeframe (https://www.mql5.com/en/forum/457154#comment_50468984), I want to come back to the undesired extra charts issue.
It goes like this:
- When running a simulation in the Strategy Tester (with "visual mode" OFF), there will always be a chart on the Terminal window, with the time frame that was given in the Settings tab (let's call it TimeFrame_X)
- This behavior is expected when the EA only uses TimeFrame_X for calculations.
- However, if the EA only uses another time frame (let's call it TimeFrame_Y) for calculations, I don't need to see any chart with TimeFrame_X.
Q1) I don't get the chart with TimeFrame_Y in the terminal window, I only get the chart with TimeFrame_X. How can I only get the chart with TimeFrame_Y in the terminal window?
Q2) Is there a way to prevent any chart to be shown in the terminal window after a simulation? (after dozens simulations, it is annoying to have to go back and close them all). I use the simulation report more often.
Q3) If I turn ON the "Visual mode" in the simulation, I get a total of three (3) charts: one useless chart at TimeFrame_X in the Terminal window, one useless chart at TimeFrame_X in the separate "visual ON" window, and the chart I need at TimeFrame_Y also in the separate "visual ON" window. I don't need the TimeFrame_X charts at all. How can I get just one chart with TimeFrame_Y in the separate "visual ON" window?
Info: I am running MT5 build 4070. Windows version running on Linux via Wine.
thank you
")
- 2023.11.09
- www.mql5.com
Hi again to all,
Now that I solved the issue with the timeframe (https://www.mql5.com/en/forum/457154#comment_50468984), I want to come back to the undesired extra charts issue.
It goes like this:
- When running a simulation in the Strategy Tester (with "visual mode" OFF), there will always be a chart on the Terminal window, with the time frame that was given in the Settings tab (let's call it TimeFrame_X)
- This behavior is expected when the EA only uses TimeFrame_X for calculations.
- However, if the EA only uses another time frame (let's call it TimeFrame_Y) for calculations, I don't need to see any chart with TimeFrame_X.
Q1) I don't get the chart with TimeFrame_Y in the terminal window, I only get the chart with TimeFrame_X. How can I only get the chart with TimeFrame_Y in the terminal window?
Q2) Is there a way to prevent any chart to be shown in the terminal window after a simulation? (after dozens simulations, it is annoying to have to go back and close them all). I use the simulation report more often.
Q3) If I turn ON the "Visual mode" in the simulation, I get a total of three (3) charts: one useless chart at TimeFrame_X in the Terminal window, one useless chart at TimeFrame_X in the separate "visual ON" window, and the chart I need at TimeFrame_Y also in the separate "visual ON" window. I don't need the TimeFrame_X charts at all. How can I get just one chart with TimeFrame_Y in the separate "visual ON" window?
Info: I am running MT5 build 4070. Windows version running on Linux via Wine.
thank you
I think you have misunderstood a few things.
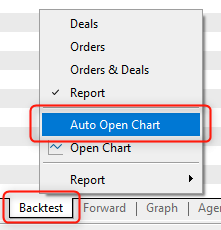
When the EA is run in the Strategy Tester in non-visual mode, no chart of any symbol or time-frame is displayed at all, unless you have enabled the option to display the chart at the end of the test. Disable that option if you don't need it.
Even if you are only referencing some other time-frame (you called it Y) in your EA, the fact remains that the EA is running on the time-frame (X) set in the Settings. So, when you run it in Visual Mode, you will never be able to NOT display the current time-frame (X) selected in the Settings.
In other words, if you don't want to see time-frame X (the one in the Settings), then simply set the Settings to time-frame Y. Why make an EA work only on time-frame Y, yet place it on chart with time-frame X?
Just make it work on the current time-frame and place it on the correct time-frame in the first place, be it in the Settings or a live Chart. Why complicate things? You are creating your own problems!
Thanks Fernando, you always come to the rescue.
I didn't know (or forgot) about the "Auto Open Chart" option. It probably was ON by default in the last re-installation of MT5 I did. Thanks for the pointing that out.
Regarding the unwanted chart of TimeFrameX in the visual mode, I always have to do what you recommend, that is, select the TimeFrameY in the Settings, so I only get one time-frame in the visual mode window.
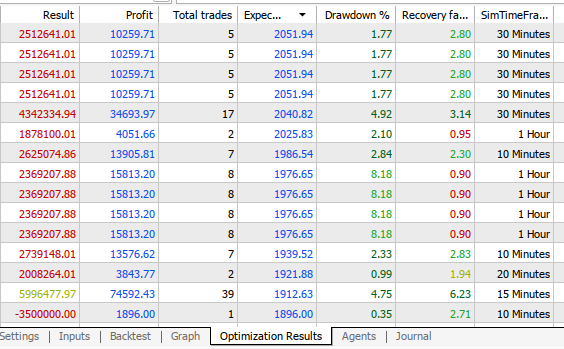
The problem with that, for me, is that I am optimizing the SimTimeFrame input variable (see image attached), and get multiple optimum timeframes that I want to individually simulate, so, for each simulation I need to go to the Settings tab, change the time-frame before I do the simulation in visual-mode. It is an inconvenient multi-step process that could be avoided if there existed an option of displaying the chart for the optimum time-frame-only by just double clicking the simulation in the "Optimization Results" table. Besides, when I get the two chart in the visual mode, my objects are drawn in the first chart, and the buy/sell objects are drawn in the second chart, that is even more annoying. I hope someone in the developing team take my suggestions.
Thank you so much for your help.
Thanks Fernando, you always come to the rescue.
I didn't know (or forgot) about the "Auto Open Chart" option. It probably was ON by default in the last re-installation of MT5 I did. Thanks for the pointing that out.
Regarding the unwanted chart of TimeFrameX in the visual mode, I always have to do what you recommend, that is, select the TimeFrameY in the Settings, so I only get one time-frame in the visual mode window.
The problem with that, for me, is that I am optimizing the SimTimeFrame input variable (see image attached), and get multiple optimum timeframes that I want to individually simulate, so, for each simulation I need to go to the Settings tab, change the time-frame before I do the simulation in visual-mode. It is an inconvenient multi-step process that could be avoided if there existed an option of displaying the chart for the optimum time-frame-only by just double clicking the simulation in the "Optimization Results" table. Besides, when I get the two chart in the visual mode, my objects are drawn in the first chart, and the buy/sell objects are drawn in the second chart, that is even more annoying. I hope someone in the developing team take my suggestions.
Thank you so much for your help.
Then there is nothing more that can be done. You will have to either ...
- ... manually set the time-frame in the Settings to the same time-frame in the input, or ...
- ... accept the extra chart in the Visual tester as they appear.
I doubt you will be able to get the developers to change this behaviour.
For example, we have been asking since the beginning (many years ago), that we be able to add graphical objects manually during the visual test, and also that the correct templates be automatically applied to the extra charts (instead of some hard-coded default look), an yet we are still waiting for those till this day.
- Free trading apps
- Over 8,000 signals for copying
- Economic news for exploring financial markets
You agree to website policy and terms of use
Hi all,
When running a single simulation in the Strategy Tester with the "visual mode with the display of charts, indicators and trades" checked ON (Settings tab), I get a new separate window with the full simulation. That is what I want. However, I also get another (undesired) chart in the terminal window with the same simulation. Is there any way to avoid having the second chart in the terminal? Is there any switch to control that? or any #property to set in the EA?
thank you.
(I am using the Linux version of MT5 (via wine))