In the chart window, histograms are drawn via pairs of buffers. If the first is higher than the second, it uses the first's color.
In a separate window, histograms are drawn from the buffer value to zero. They are drawn from the first to the last. If you want one to be the background, it must be the first buffer.
See also
How to Draw Cnadle chart in indicator_separate_window ? (XDXD) - MQL4 programming forum (2016)
William Roeder #:
In the chart window, histograms are drawn via pairs of buffers. If the first is higher than the second, it uses the first's color.
In a separate window, histograms are drawn from the buffer value to zero. They are drawn from the first to the last. If you want one to be the background, it must be the first buffer.
See also
How to Draw Cnadle chart in indicator_separate_window ? (XDXD) - MQL4 programming forum (2016)
Thank you William! But this tool is for MT4. I'm on MT5 unfortunately
- The tool was not what you wanted, but would get you started.
- There is no “unfortunately.” Convert it. Show us your attempt (using the CODE button) and state the nature of your difficulty.
No free help (2017)Or pay someone. Top of every page is the link Freelance.
Hiring to write script - General - MQL5 programming forum (2018)We're not going to code it for you (although it could happen if you are lucky or the issue is interesting).
No free help (2017)
- The tool was not what you wanted, but would get you started.
- There is no “unfortunately.” Convert it. Show us your attempt (using the CODE button) and state the nature of your difficulty.
No free help (2017)Or pay someone. Top of every page is the link Freelance.
Hiring to write script - General - MQL5 programming forum (2018)We're not going to code it for you (although it could happen if you are lucky or the issue is interesting).
No free help (2017
No one asked you or anyone else to code, William. The question was if theres' a utility or indi that plots a simple price. I'm sure there is. "We"... who is "we"?
Why in such a patronizing tone?
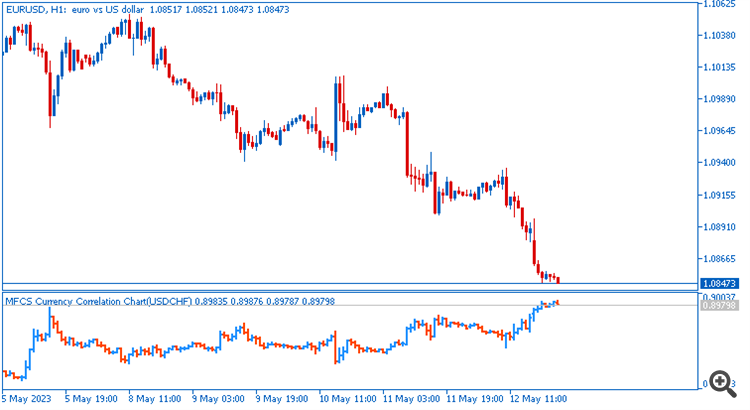
Hi, I'm looking for a very simple tool, but just can't find it on the market.
I want to plot USDCHF underneath EURUSD (as if in indicator window). So simple. Is there a utility or indi for that?
I am not sure that it is what you are looking for ...
but there is one indicator in CodeBase:
MFCS Currency Correlation Chart - indicator for MetaTrader 5
I attached the file I am using (seems it is corrected one).
-----------------
You can check more on CodeBase for example.

- www.mql5.com
I am not sure that it is what you are looking for ...
but there is one indicator in CodeBase:
MFCS Currency Correlation Chart - indicator for MetaTrader 5
I attached the file I am using (seems it is corrected one).
-----------------
You can check more on CodeBase for example.
Thank you Sergey, this is exactly what I was looking for! )))))))
- Free trading apps
- Over 8,000 signals for copying
- Economic news for exploring financial markets
You agree to website policy and terms of use

Hi, I'm looking for a very simple tool, but just can't find it on the market.
I want to plot USDCHF underneath EURUSD (as if in indicator window). So simple. Is there a utility or indi for that?