You are missing trading opportunities:
- Free trading apps
- Over 8,000 signals for copying
- Economic news for exploring financial markets
Registration
Log in
You agree to website policy and terms of use
If you do not have an account, please register
that's the whole problem, it's not clear. Most likely the window should be floating, along with the floating pitch. The best thing I can think of is to keep the density stable and change the pitch and width of the window to match it.
And how do you measure density stability?
And how do you measure density stability?
I haven't looked into how to measure density yet. I have an idea that price will avoid points that it has hit many times. It means that this chart will contain dark points and the price will probably try to fill the screen evenly, thus creating new dense points.
Another idea for kanvas is to plot a three-dimensional probability density function and see how it changes its shape in real time (or in the tester).
The probability density function is plotted for a fixed value. For example, we take a period of 100 candlesticks and measure the number of points the price has passed in n tries. But why exactly 100??? is the big question. The third measurement will be the range from 10 to 1000. Thus we will measure not only how many points the price moved but also in what range, the picture will be fuller. We obtain the three-dimensional probability density function, all variants for 10 candlesticks, 11, 12, 13, 14, etc. It may be interesting. Of course it can be done in Excel, but it will be much more interesting if it changes in real time in the tester, if the canvas works in the tester of course.
I haven't yet tackled the question of how to measure density. There is an idea that the price will avoid points that it has hit many times. It means that there will be dark points on this chart and probably the price will try to fill the screen evenly, thus creating new dense points.
The price, on the contrary, concentrates around levels - bands and makes jumps between them, like transitions between energy levels, between which the probability density is low (go to my profile, you will find where to see it).
I was getting the opposite value over a long period of time. I checked on 28 forex pairs, MOEX stocks and BTCUSD. As such I haven't found any reliable levels where the probability of price stalling is different than 50%.
I was getting the opposite value over a long period of time. I checked on 28 forex pairs, MOEX stocks and BTCUSD. As such I haven't found any reliable levels where the probability of price stalling differs from 50%.
Processes are non-stationary, everything changes, including the probability density. Therefore, the probability density is in a moving window, like, say, a moving average. Taking a long period of time, in order to identify the probability density function on it, makes no sense here. After all, we need to identify the current state of the market.
that's what I'm talking about, what the current consolidation levels depend on. Perhaps they appear where there was previously a low density.
that's what I'm talking about, what the current consolidation levels depend on. Perhaps they appear where there was previously low density.
Are you hinting at diffusion or a kind of pressure of "substance" of price distribution to where there was less before.
Yes, I prefer the wave model, where every point reached by the price becomes a source of waves of amplitude of its probability density that (all partial waves) are summed over the whole space. At some levels its positive interference occurs - that's consolidation for you.
If you drink strong 'kvass', the world will sink into canvas. :)
I propose the idea for a practical application of canvas and it's a completely new direction.
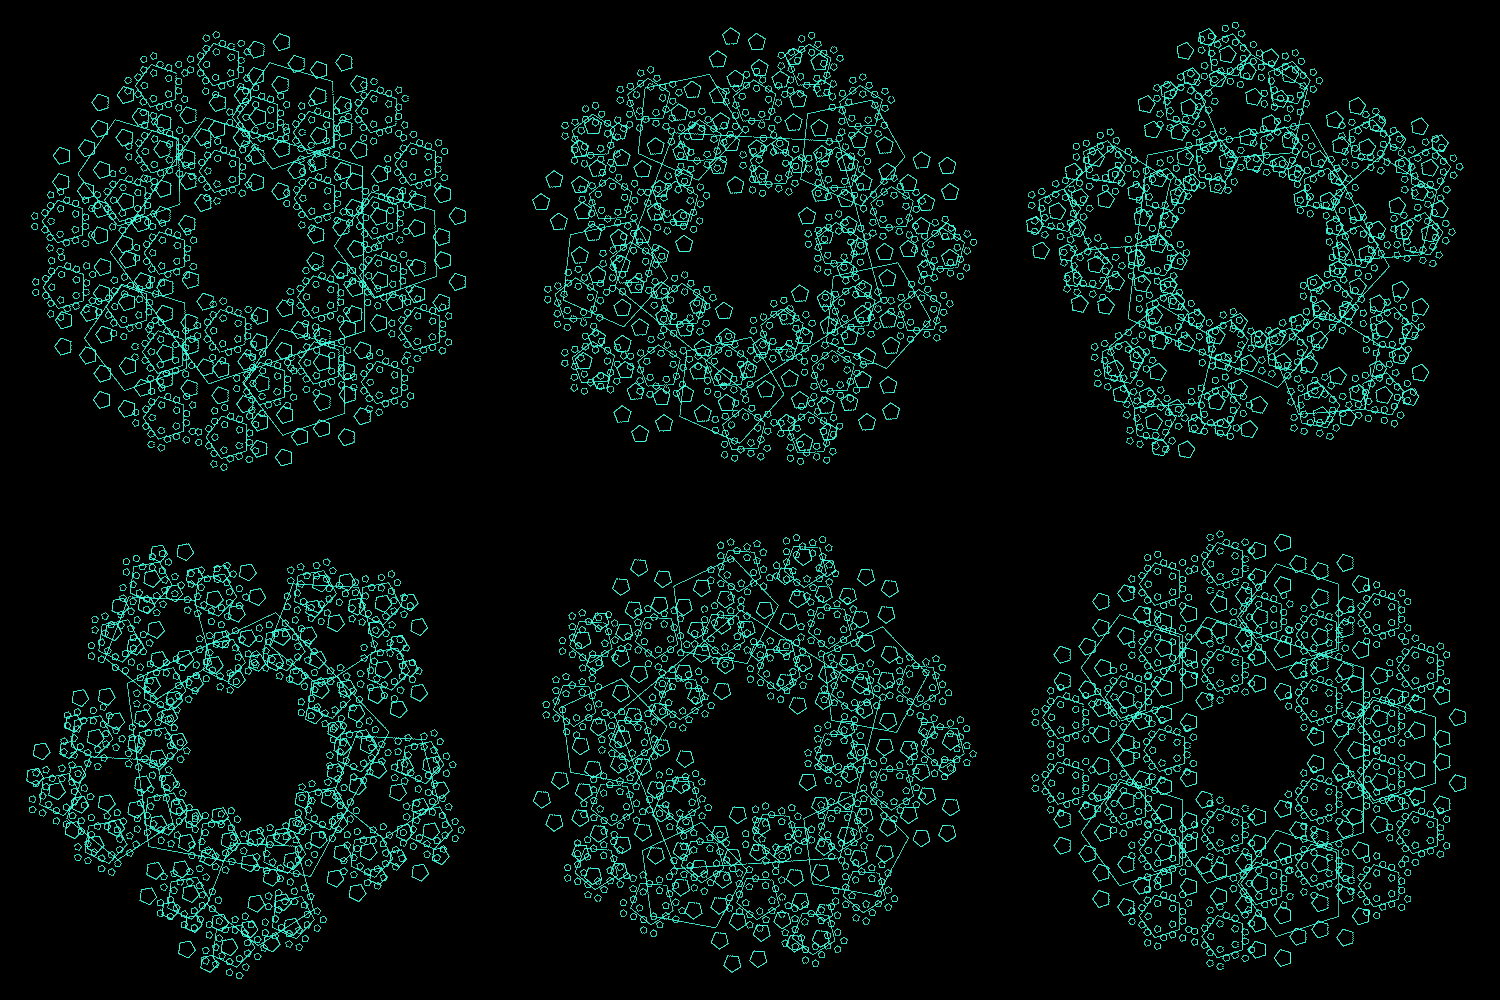
The picture shows a fractal. Maybe, according to the history of quotations (sliding windows) we can calculate their fractal structures and translate them into similar graphic images that will serve to identify the market situation. We will obtain a peculiar indicator.For example, in physics (of a solid body) by the Fermi's surface one can judge about the state of the material, also one can judge about the state of the market by the fractal images, because as the empirical material accumulates, the language of the images' accordance with the concrete states of the market will be formed.
It doesn't look like a fractal. It is a kaleidoscope of some kind.
Here are examples of fractals:

It doesn't look like a fractal. It's a kaleidoscope of sorts.
Here are examples of fractals:
The middle picture was stuck for about five minutes...