Distribution of a continuous value - page 2


So far it's all about statistical rubbish in the style of Bryusov:

Maybe these candlelit bars
Worlds with five continents,
The arts, knowledge, wars, thrones
And the memory of forty centuries!

 
Yury Kirillov:

So far, it's all just circa-statistical Bruce-esque rubbish:


What's it to you?

 
Evgeniy Chumakov:


Good! Let it be non-random, I have renamed the branch. I should also remind you that, unlike Alexander, I work with minute charts.

Will it be continuous? The general notion of continuity: small changes in the argument correspond to small changes in the function. And in your case the changes of the function cannot be smaller than a point...
 

Only here I have taken a different input data.


p.s. Dear local physicists, mathematicians and so on! Since I am not a physicist or mathematician, there is no need to push your intelligence. Better yet, give links to your scientific articles, publications where they have been published.

 
The idea is that the channel should not be built from price increments or anything else. More precisely, a channel with an average is already there by itself, it just needs to be brought to a certain value.
 

Price after returning inside the channel:


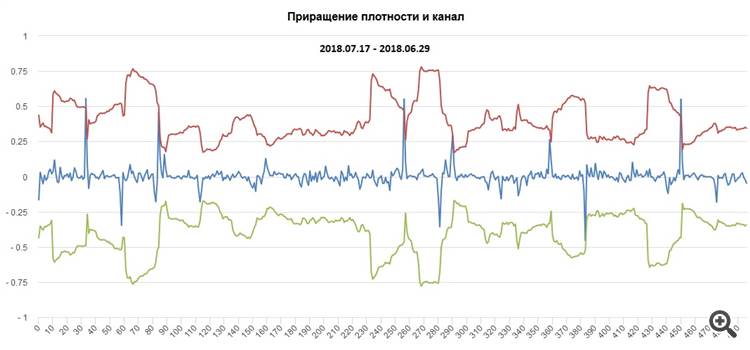
The method here is a little different. Not all the bars in a row are taken for the calculations.
 
EURUSD

SymbolEURUSD.e (Euro vs US Dollar)
Period1 Minute (M1) 2018.05.07 00:00 - 2018.07.17 13:33 (2018.05.07 - 2018.07.18)
ModelBy open prices (only for Expert Advisors with explicit bar open control)
ParametersLOT_SIZE=0.1; TAKE_PROFIT=200; STOP_LOSS=1000; MAGIC_NUMBER=23123123; Depth=24; Sample=24;

Bars in history74780Simulated ticks148331Simulation qualityn/a
Chart mismatch errors0


Initial deposit10000.00

SpreadCurrent (3)
Net profit94.41Total profit103.68Total loss-9.27
Profitability11.18Expected payoff9.44

Absolute drawdown93.17Maximum drawdown93.17 (0.93%)Relative drawdown0.93% (93.17)

Total trades10Short positions (% win)6 (83.33%)Long positions (% win)4 (100.00%)

Profitable trades (% of all)9 (90.00%)Loss trades (% of all)1 (10.00%)
Largestprofitable trade33.63losing transaction-9.27
Averageprofitable deal11.52losing trade-9.27
Maximum numbercontinuous wins (profit)9 (103.68)Continuous losses (loss)1 (-9.27)
Max.Continuous Profit (number of wins)103.68 (9)continuous loss (number of losses)-9.27 (1)
Averagecontinuous winnings9Continuous loss1

TimeTypeOrderVolumePriceS / LT / PProfitBalance
12018.05.31 12:02buy10.101.171511.161511.17231
22018.06.04 12:06t/p10.101.172311.161511.172316.3310006.33
32018.06.05 14:41sell20.101.168521.178521.16761
42018.06.05 15:11t/p20.101.167611.178521.167618.6310014.96
52018.06.14 14:46sell30.101.184671.194671.18126
62018.06.14 14:47t/p30.101.181261.194671.1812633.6310048.59
72018.07.02 18:02buy40.101.160581.150581.16237
82018.07.02 23:11t/p40.101.162371.150581.1623717.4410066.03
92018.07.04 08:58sell50.101.167031.177031.16651
102018.07.04 09:04t/p50.101.166511.177031.166514.7310070.76
112018.07.06 10:26buy60.101.170641.160641.17267
122018.07.06 15:31t/p60.101.172671.160641.1726719.8310090.59
132018.07.09 02:44sell70.101.174841.184841.17435
142018.07.09 18:49t/p70.101.174351.184841.174354.4310095.02
152018.07.13 09:03sell80.101.165841.175841.16545
162018.07.13 09:11t/p80.101.165451.175841.165453.4310098.45
172018.07.16 13:31buy90.101.170481.160481.17105
182018.07.16 13:52t/p90.101.171051.160481.171055.2310103.68
192018.07.17 09:13sell100.101.171531.181531.17103
202018.07.17 13:33close at stop100.101.172411.181531.17103-9.2710094.41


On the other pairs, however, the picture is not as pretty. It's on the channels from the picture above and experimenting with a slightly different approach.


In general, I don't think Alexander can be helped by increasing the observation window, reading ticks after a certain time and so on.

I think it is necessary to work not with prices, but with probabilities of events (not a fact, but maybe time plays some role).

Let local mathematicians and physicists correct me if this is wrong.