From theory to practice - page 1248
You are missing trading opportunities:
- Free trading apps
- Over 8,000 signals for copying
- Economic news for exploring financial markets
Registration
Log in
You agree to website policy and terms of use
If you do not have an account, please register
Martin_Apis_Bot Cheguevara:
As always all brilliant is simple:)
Why is the demo signal available again? You said it won't be available from 27.04.2019 so keep your word))
No hard feelings. I will add another picture for completeness of understanding.
Tool and TF are the same.
Blue channel of the previous drawing worked out and died, left behind a red line.
The red one developed (even got pregnant with a blue channel).
Born early. Green fleecy says to grow a little or there will be a miscarriage.
Everything is like in nature. They're born, they live, they die.
Tell us, at least graphically, how you see the channel. What properties does it have. To try to transfer this information to machine code.
...
Here is the trading channel:
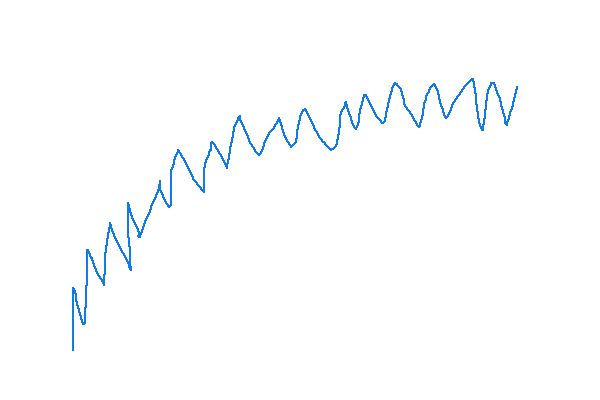
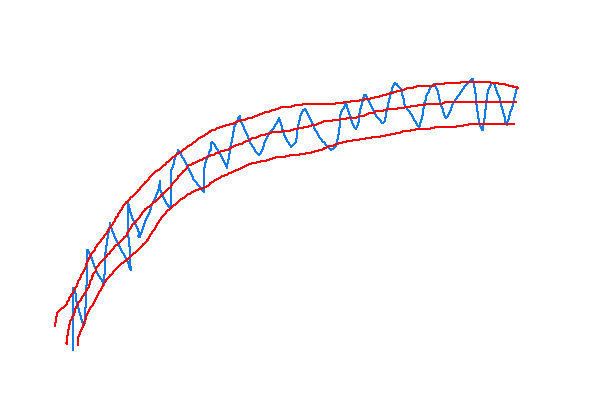
You can draw a central trend curve on it.
You can also copy this curve up by n pips and down by n pips.
The upper extrema of the channel always almost hit the upper red line.
The lower extremums of the channel always nearly hit the lower red line.
Perhaps this property can be somehow used for identification of trading channels...
If we detrend this chart (take the central indicator chart from the price chart), the resulting chart will be distributed evenly.
How can we measure the "evenness" of the distribution?
Here is the trading channel
You can draw a central trend curve on it.
You can also copy this curve up by n points and down by n points.
The upper extrema of the channel always almost reach the upper red line.
The lower extremums of the channel always nearly hit the lower red line.
Perhaps this property can be used in some way...
If we detrend this chart (take the central indicator chart from the price chart), the resulting chart will be evenly distributed.
There are no such graphs as you have drawn. There are clear patterns of vertex behaviour. Subject to a certain rule. More like a law.
It doesn't matter if it's a currency pair chart or a sunspot chart.
There are no such graphs. There are clear patterns of vertex behaviour. Subject to a certain rule. More like a law.
Are you saying that you know in advance the points on the graph where the tops and troughs will form?
Are you saying that you know in advance the points on the chart where the tops and troughs will form?
I don't want to offend you by saying yes).
There are no such graphs as you have drawn. There are clear patterns of vertex behaviour. Subject to a certain rule. More like a law.
It doesn't matter if it's a currency pair chart or a sunspot chart.
There will never be such a perfect picture in nature.
There will be a picture that is more or less close to perfect.
I drew a perfect picture.
There won't be such a perfect picture in nature.
There will be a picture in one way or another close to perfect.
You can look at millions of charts and you won't see a chart like this anywhere.
Let me hint to you that there are strict rules about the behaviour of any graph. I didn't come up with that.
You can look at millions of charts and you won't see a chart like this anywhere.
Let me hint to you that there are strict rules about the behaviour of any graph. This was not invented by me.
Here, eurochief, M30.
Here. Now use the graph to draw the tops. It might make more sense to you.