From theory to practice - page 993
You are missing trading opportunities:
- Free trading apps
- Over 8,000 signals for copying
- Economic news for exploring financial markets
Registration
Log in
You agree to website policy and terms of use
If you do not have an account, please register
I have a chart of how currencies relate to each other like this.
Currencies: euro-magenta, dollar-green, pound-blue, franc-red and yen-white.
And here is the demand chart for euro and dollar currencies. How the pair reacts.
If so, it would be useful to move from rates in currency pairs to the purchasing power of currencies in order to identify the hour X. It then becomes better seen how much less fluctuating the strength of the USD is compared to the others, and how when its strong movement occurs, it drags all other currencies along with it.
By the way, here is a picture of one trading day, with the same meaning of the charts as you have, only there are more of them. The USD/USD is the sum of relative (since the beginning of the day) changes of VAL/USD, and its chart is also black. On the horizontal line, it is the number of fifteen-minute periods from the beginning of the day.
Yes, the graphs are built similarly (except that in my case it is from the beginning of the day, and not from the beginning of the day) and show approximately the same thing accordingly.
A good, correct chart - more than once warned against wrong actions. Signals on an individual pair may have any strength, but if they contradict the quid and the overall movement, it is a flop...:-) And vice versa - if someone is lagging behind, he is going to "bang".
It seems reasonable to switch to purchasing power, but how to calculate it from the available data...
Yes, the graphs are similar (except that my graphs are from exactly a day ago, not the beginning of the day) and show approximately the same thing.
A good, correct chart - more than once warned against wrong action. Signals on an individual pair can have any strength, but if they contradict the quid and the overall movement, it's a flop...:-) And vice versa - if someone is lagging behind, he is going to "bang".
It seems reasonable to switch to purchasing power, but just how to calculate it from the available data...
It's hard for me to completely unravel the picture of how to calculate, I did it a few years ago. But I will give comments on the resulting code. I usually write the comments so that after 8 years I can understand them and replay what they are commenting on. For example, when switching to another programming language. Here's what I have written down:
In fact, a lot has been written about indexes as geometric averages,
but their product turns out to be unitary, with no reference to the initial
values. So: let's multiply currency rates to USD EURUSD AUDUSD GBPUSD 1/USDCHF
100/USDJPY NZDUSD 1/USDCAD and 1=USDUSD, multiplying the result by -1/8, which
will be a norm other than one. Divide all these rates by the norm, then
the product of 8 powers = 1. This is a new normalization, it is no longer the sum of
of the relative deviations from the initial values - this linkage to the starting point
has disappeared
https://www.mql5.com/ru/forum/114579/page18 - here the approach is justified by
For a basket of currencies
USD EUR GBP JPY CHF we use a 5x5 matrix with rows
USD USDUSD USDEUR USDGBP USDJPY USDCHF
EUR EURUSD EUREUR EURGBP EURJPY EURCHF
GBP GBPUSD GBPEUR GBPGBP GBPJPY GBPCHF
JPY JPYUSD JPYEUR JPYGBP JPYJPY JPYCHF
CHF CHFUSD CHFEUR CHFGBP CHFJPY CHFCHF
By multiplying the elements in one row we obtain XXX^5 / (USD*EUR*GBP*JPY*CHF). The root
of power 5 gives in the numerator the power of currency XXX, while the denominators are all the same:
The geometric mean of all the currencies in the basket. This leaves one degree of freedom -
the multiplier of the denominator
I saw that at 17:00 and 18:00 of each day the ratio of candle tails to the candle body is very high. I wrote an Expert Advisor on this topic.
showed this:
I took into account the spread of 0.00005.)
And I've been craving to study tick volumes again. Clotted-dissipated tick flow over time. The non-linearity of time in the market, so to speak...
Since we are talking about the mysteries of the market - this non-linearity is the ultimate mystery, and where there are mysteries, there is gold.
Returnees are certainly a good thing. Even if the distribution isn't exactly Laplace.
But... There is such a grey truth in life :
It's the "relative fluctuations" of the indices of the major majors.
You can see with the naked eye that 80% of the time they are basically doing their own thing.
But ! There comes (periodically all the time) the X hour, when the evening is no longer languid and the movements are in the same stream.
Does anybody have an idea how to catch such moment? We have a bunch of graphs M, and to catch synchronous moves N (close to M) of them
Make a "dominant currency index". As soon as the dominance disappears, (the colour changes) something happens. The main thing is to reduce everything to one graph.
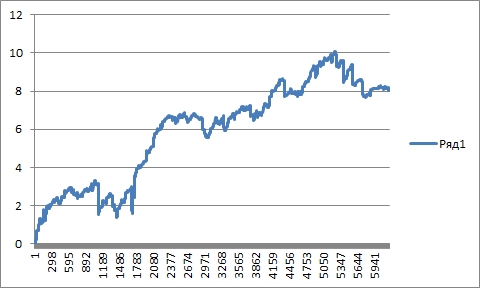
At the moment, my TC is 166th place (+41% per month) out of 1,625 contestants.
The contestants are fighting like lions and showing some crazy results... Literally, up to +5000% per month. Now I understand why there are so many people around Forex :))) If you have a chance, you can really buy a flat in Moscow in one month. That's amazing.
Look at the current contest https://fortrader.org/contests/intellect-algoritm. The leader has increased the demodeposit from 1,000 to 378,000, 378 times, over the period 15-22.02.2019, in one week. So 5k interest (50x) in a month is still not great. However, there is no such performance in real life.
Make an "index of the dominant currency". As soon as the dominance disappears, (the colour changes), something happens. The main thing is to reduce everything to one graph.
The emergence of a clear one is a sign of things to come. There is a fundamental reason for that: if the currency is rising / falling faster and more steadily against the dollar than others, then it is out of the main stream and is about to "bang". :-) Apparently the bank risks on it become excessive and it is being corrected.
Take a look at the current competition https://fortrader.org/contests/intellect-algoritm. The leader has increased the demodeposit from 1,000 to 378,000, 378 times, over the period 15-22.02.2019, in one week. So 5k interest (50x) in a month is still not great. However, this kind of performance does not happen in real life.
How can we comment on this?
arbitrage
Tickmill aggregator, and they pamper the liquidators with rotation (as you can see by the frequency of ticks and seasonal fluctuations in the spread).
well done, what else to say :-)