From theory to practice - page 163
You are missing trading opportunities:
- Free trading apps
- Over 8,000 signals for copying
- Economic news for exploring financial markets
Registration
Log in
You agree to website policy and terms of use
If you do not have an account, please register
Now look at what I've got happening on the USDJPY:
Above is a chart of the USDJPY proper and the Bollinger Bands with 4*sigma. The sample volume is 25.600 ticks, which corresponds to 99.5% confidence interval of the wave packet of tick increments. I.e. we see the wave packet of the price and its movement VERY completely.
The trades were made on the lower chart (see the algorithm outlined in this thread).
A cool 3 trades at a gorgeous profit. And one of the most shameful deal in the deepest minus of 1000 pips (highlighted by red arrows).
So I look and look at these charts this way and that, and I understand that - everything is gone, Alexander_K and Schrodinger's cat (sitting next to me with bulging eyes and can't say anything)...
What am I supposed to do - keep 3 green deals and remove 1 red one?
That's it - time to call it a day and get away from Forex.
Of course, you're in a trend.
Of course, you're on a trend.
It doesn't matter at all. You can work fine on a trend on pullbacks as well. The problem is different.
in his particular case, the problem is this. (deal)
and his particular case is the problem
...
Here's the result from Monday.
Martingale lives from Monday to Monday?
:)
That's what I'm saying - it's not that. The hit is the consequence. The idea itself is correct, but the intertrap...)
I wonder where the idea came from.
read on the forum that people trade deviations from the average during a flat?
Or did you see that in physical processes the particle dangles around the horizontal line and decided that it's the same at Forex ?)
Nothing is signalling this, no characteristics.
Compare the volatility on the 1st site and the 2nd site and you say no characteristics are signalling anything.
This is also the answer to Alexander's question.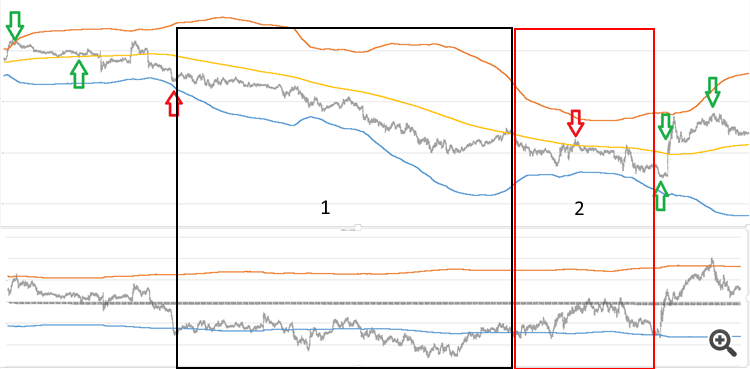
and what does this tudent distribution of yours mean? what does it show? what memory does it have and how do you trade it?
and how do you explain the fact that in forex the distribution chart has an elongated vertical shape?
Compare the volatility on the 1st plot and on the 2nd plot, and you say no characteristics are signalling.
This is also the answer to Alexander's question.
There may be more volatility both on the trend and on the flat
Compare the volatility on the 1st plot and on the 2nd plot, and you say no characteristics are signalling.
This is also the answer to alexander's question.
Why do you think you can't trade deviations from the dashboard on a trend? You only need to build a dashboard that follows the centre of the price channel. you saw how the dashboard behaves during an up trend, it goes under the price, not inside it. the task is to build the right dashboard)