From theory to practice - page 159
You are missing trading opportunities:
- Free trading apps
- Over 8,000 signals for copying
- Economic news for exploring financial markets
Registration
Log in
You agree to website policy and terms of use
If you do not have an account, please register
The key thing you need is an algorithm that signals in advance a change in the nature of the trend, a trend change to another trend or a flop change to a trend, a trend change to a flop.
No one knows when the flat ends and the trend starts, and when the trend ends and the flat starts. There is no Expert Advisor that can determine this by anything.
Why is stochastic or MACD worse?
Because I don't see the physical meaning of these indicators.
And here everything is as clear as God's day. This is the distribution of increments: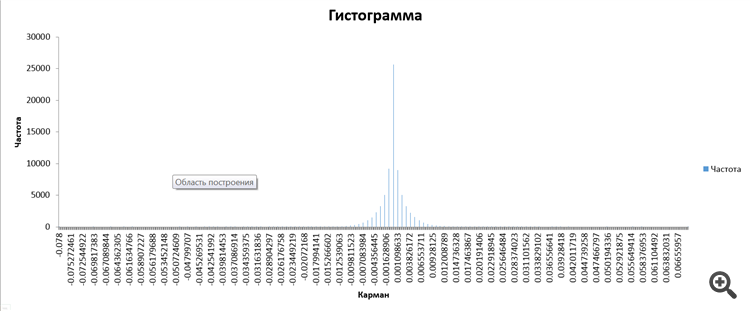
And there is the actual wave function of the price itself.
There is no other meaning to it.
We observe exactly this wave packet over time as a numerical solution of the Fokker-Planck equation.
Here this packet - it sort of "vibrates" relative to 0, obeys some sort of Law of Vibration that Gunn used.
And that's exactly the movement we see in the graph below:
That's it - the problem is essentially solved.
But, hell, I still have a negative open position on USDJPY - I don't know how to explain it. By the way, I'm not surprised if the algorithm will eventually pull it to 0. Or maybe not.
Most likely it's a matter of calculating the exact sample size and something else... This is something someone has yet to find and get recognition in the form of a Nobel Prize. In the meantime, I'll use a stop-loss and that's it.
Why not use another indicator in addition to the algorithm described in this thread?
And just becauseI personally do not see any physical sense in ALL indicators, there is no theoretical basis, if you can provide a link to a rigorous substantiation of any indicator, I would be very grateful.
Because I don't see the physical meaning of these indicators.
Here, it's as clear as daylight. This distribution of increments:
is actually the wave function of the price itself.
There is no other sense in it.
We observe exactly this wave packet over time as a numerical solution of the Fokker-Planck equation.
Here this packet - it sort of "vibrates" relative to 0, obeys a sort of Law of Vibration, which was used by Gunn.
And that's exactly the movement we see in the graph below:
That's it - the problem is essentially solved.
But, hell, I still have a negative open position on USDJPY - I don't know how to explain it. By the way, I'm not surprised if at the end of the day the algorithm pulls it to 0. Or maybe not.
Most likely it's a matter of calculating the exact sample size and something else... This is something someone has yet to find and get recognition in the form of a Nobel Prize. In the meantime, I'll use a stop-loss and that's it.
Why not use another indicator in addition to the algorithm described in this thread?
It is because I personally do not see any physical sense in ALL indicators , there is no theoretical justification, if you can provide a link to a rigorous justification of any indicator, I would be very grateful.
Not seeing doesn't mean it doesn't exist, better to say I don't know.
If you dig around you can find the descriptions yourself.
At a glance, from memory I can tell you the meaning of MACD, it is an indicator that takes the difference of two cycles.
The slow line, usually has a period of 26 in the standard settings, which is the half-period of a year on a weekly chart (52 weeks a year).
The fast line 12, is the length of the quarter. Their difference (MACD histogram) reveals the annual overbought/oversold cycles.
The wave from the histogram has a period of 3/4 of that of the fast line, for the 12 it is 9.
Which divides the movement into three parts, new trend emergence (when the signal is in the cloud), or in other words the first wave.
Trend development (when the signal moves out of the cloud) is the third wave, and trend completion (when the signal moves back into the cloud) is the fifth wave.
Not seeing it doesn't mean it isn't there, it's better to say I don't know.
If you look around, you can find a description for yourself.
Just from memory I can tell you the meaning of MACD, it is an indicator that takes the difference of two cycles.
The slow line, usually with a period of 26 in the standard settings, is the half-period of a year on a weekly chart (52 weeks a year).
The fast line is 12, which is the length of the quarter. Their difference (MACD histogram) reveals the annual overbought/oversold cycles.
The wave from the histogram has a period of 3/4 of that of the fast line, for the 12 it is 9.
Which divides the movement into three parts, new trend emergence (when the signal is in the cloud), or in other words the first wave.
Trend development (when the signal moves out of the cloud) is the third wave, and trend completion (when the signal moves back into the cloud) is the fifth wave.
Stochastic - normalisation, MACD - bandpass filter.
Gentlemen, how do I get in line for the Nobel Prize?
I seem to have seen what the "memory" of the non-Markovian market process looks like in the example of increments after all.
That's how it is: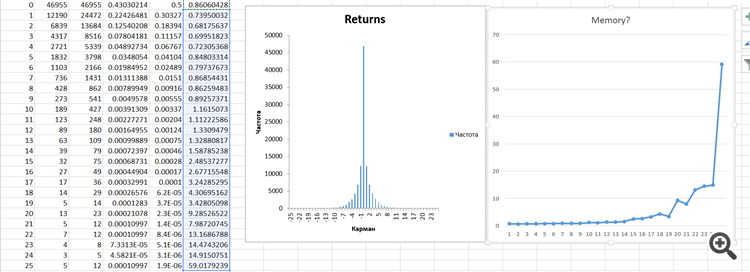
This is the 6th column on the left in the table and the graph on the far right.
From this graph we can conclude that for increments <25 there is a flat due to the "memory" action. As soon as an increment >=25 occurs, it indicates a "switch" from one state to another - i.e. a trend starts. Like this!
Where-where did you say the money comes from? Is there a branch of Nobel Committee in Moscow?
Gentlemen, how do I get in line for the Nobel Prize?
I do seem to have seen how the "memory" of the non-Markovian market process looks like on the example of increments.
Here's how:
This is the 6th column from the left in the table and the graph on the far right.
From this graph we can conclude that for increments <25 there is a flat due to the "memory" action. As soon as an increment >=25 occurs, it means "transition" from one state to another - i.e. a trend has started. Like this!
Where-where did you say the money comes from? Is there a branch of the Nobel Committee in Moscow?
I don't understand a fucking thing, but it's very interesting.
I don't fucking get it, but it's very interesting.
It's cool, isn't it?
So - it's to the point that that incremental distribution is nothing more than the product of 2 probability density functions :
1. A bilateral geometric "no memory"
2. some kind of distribution (I thought it was a t2-distribution), which is exactly responsible for memory.
Look closely at the columns of the table:
#4 - the real distribution of the AUDCAD pair increments, after reduction to a one-way form.
№5 - exponential distribution at lambda=0.5.
#6 - quotient of division of #4 and #5 - this is the distribution of "memory" of the process.
I'm off to get my pockets ready.
Nice, isn't it?
So - it's to the point that that incremental distribution is nothing more than the product of 2 probability density functions:
1. a bilateral geometric "no memory"
2. some kind of distribution (I thought it was a t2-distribution), which is exactly responsible for memory.
Look closely at the columns of the table:
#4 - real distribution of increments on AUDCAD pair, after reduction to one-way form.
№5 - exponential distribution at lambda=0.5.
#6 - quotient of division of #4 and #5 - this is the distribution of "memory" of the process.
I'm off to get my pockets ready.
I understand all this, how to divide them to see parameters of both distributions separately?
There may be not two, but more.
SZS There was a discussion on the forum once: is Forex market an amoeoba reacting to stimuli a simple living being, or a solaris an amorphous collective mind. In the light of this question (imho) in the market there is both, individual traders, although larger in volume, but they are meat (plankton that ate) behave like ameobes, while mutual funds, banks show intelligent behaviour, rational (well it is debatable, they can be wrong), at least they try to behave rationally.
I understand all this, how do I separate them to see the parameters of both distributions separately?
There could be more than two.
No way - 2 and full stop.
See attached file. Now we just have to make sure that at increments >=25 pips the trend starts. It just has to be, since the "memory" with the previous distribution is almost completely lost.