From theory to practice - page 90
You are missing trading opportunities:
- Free trading apps
- Over 8,000 signals for copying
- Economic news for exploring financial markets
Registration
Log in
You agree to website policy and terms of use
If you do not have an account, please register
Further, I analyse price movements exactly with this method of tick quotes reception and the given estimated sample size.
For example, for the AUDCHF pair when modelling in the Vissim system, for data from 15.09.2017 to 31.10.2017, I get the following 3 potential trades:
On the charts you see:
The red and blue lines are the Bollinger Bands for a given tick sample volume.
The orange and turquoise lines are the historical channel calculated from historical data.
Trades must be executed when the price exceeds both historical and current values of dispersion.
Thus, we would have 3 deals during 1.5 months for AUDCHF.
In my calculations I also apply the nonparametric skew coefficient.
For this pair, the historical value of this coefficient modulo = 0.15. I.e. a deal is executed not only when overcoming historical and current values of the dispersion but also when the price distribution is maximally oblique relative to the averaged historical value.
Based on this - trade #1 would not have been executed, because the nonparametric skew was = 0
Trades #2 and #3 would have been executed, the nonparametric skew would have been <-0.15.
The total profit on these two trades would have been 655 pips.
Welcome back! Personally, I was interested to read the thread.
Last week we have the following picture for AUDCHF:
As you can see, none of the 2 conditions to open a trade were met.
Therefore, last week there were no trades on AUDCHF.
This is to the question whether it is necessary to trade on as many currency pairs at the same time as possible. I've finally decided for me that it is necessary, otherwise I will have no trades, no profit and will die of boredom. :))))
Sincerely,
Alexander_K2 aka Alexander_K
Here's what I was thinking.
Having seen the utter dumbing down and feralisation of people here, I will still sometimes Maybe this will help intelligent people, who are just reading the forum and searching for some new solutions for these or those problems.
So:
1. To the question of the method of reading tick data.
I finally decided for myself to read tick quotes in exponentially distributed time intervals. And further I consider the sequence of average values between two consecutive quotes. What does it give me? For me it is the only way to bring the distribution of increments to a pure "bell-shaped" form, which is very important. Besides, as my researches have shown - non-markoving of the price movement process, even with such a method of receiving ticks, doesn't disappear in any way, i.e. there is "memory" in the market and it simply must be considered in my calculations.
2. Concerning the calculation of a necessary and sufficient volume of tick quotes sampling.
I do it the following way. I take my personal archive of ticks collected using the method described in paragraph 1, and analyze tick increments in Excel.
For example, for AUDCHF I obtain a histogram
and statistics:
The sample volume is calculated from the Chebyshev inequality using the formula I have already given in this thread. This volume covers 99.8% of the distribution of increments in bilateral tests. I.e. at each computational step, when accepting the next tick, we know for sure that we are working with the maximum possible set of data needed for research.
And this sample size is true for any tick reading method, which proves the self-similarity or fractality of the market.
Alexander_K2)
For the AUDCAD pair last week there would have been 2 trades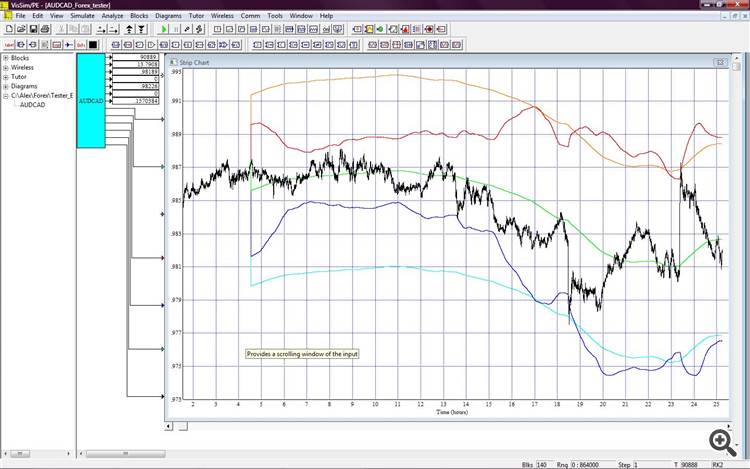
Total profit for the week = 820 pips.
Here's what I thought.
Having seen the utter stupidity and savagery of people here, I will still occasionally publish the results of my research - maybe it will help intelligent people who simply read the forum and look for some new solutions to these or those problems.
You are absolutely right, namesake!
Maxim was right about that:
And all because envious persons, losers and losers, which are always the vast majority, destroy any attempt at constructiveness on the forum. And moderators, instead of stopping trolling and flooding, contribute to it:
Understandably, it's not easy to hold your line in such a situation. But you do not pay attention to spiteful people because there will be no less of them, and you have no other way to fight except ignoring them.
You should monitor your trading account, because no one believes the profit claims on this forum. You can monitor your account at myfxbook.com or give you the investment password. As a last resort you can periodically post your statement but even your statements are not reliable and may be easily falsified.
Many people who are interested in and follow the subject. You are doing a good thing.
Do not give up: the dog barks, the caravan moves!
Absolutely correct decision, namesake!
Maksim made a good point here:
And all because envious people, losers and losers, which are always the vast majority, destroy any attempt at constructiveness on the forum. And moderators, instead of stopping trolling and flooding, contribute to it:
Understandably, it's not easy to hold your line in such a situation. But you do not pay attention to spiteful people because there will be no less of them, and you have no other way to fight except ignoring them.
You should monitor your trading account, because no one believes the profit claims on this forum. You can monitor your account at myfxbook.com or give you the investment password. As a last resort you can periodically post your statement but even your statements are not reliable and may be easily falsified.
Many people who are interested in and follow the subject. You are doing a good thing.
Do not give up: the dog barks, the caravan moves!
For the AUDCAD pair last week there would have been 2 trades
Total profit for the week = 820 pips.
For the sake of purity of the experiment, calculate some other simple algorithm in parallel, e.g. by MA crossing)
(with approximately the same period/duration)
For the AUDCAD pair last week there would have been 2 trades
Total profit for the week = 820 pips.