EURUSD signal - page 8
You are missing trading opportunities:
- Free trading apps
- Over 8,000 signals for copying
- Economic news for exploring financial markets
Registration
Log in
You agree to website policy and terms of use
If you do not have an account, please register
affect more than all the news and expectations put together
Can you show on any TF (and instrument) a chunk of prices affected by the price in the previous section? Just 2 chunks:
1) what price affected
2) which price was affected.
Purely for the sake of science :)
Considering the topic of the branch, it would be even cooler if it were EURUSD, so as not to get off-topic. I will explain my point of view. You do not have to explain yours :) Or after my grounding.
I will tell you right away, I will not be able to answer quickly.
Can you show on any TF (and instrument) a chunk of prices affected by the price in the previous plot? Straightforward 2 chunks:
1) what price affected
2) which price was affected.
Purely for the sake of science :)
Considering the topic of the branch, it would be even cooler if it were EURUSD, so as not to get off-topic. I will explain my point of view. You do not have to explain yours :) Or after my grounding.
I will tell you right away - you will not get a fast reply.
AUDNZD - short to 1.07
eurojop - short
Eurobucks - short too
now how was it clear that short, by the time
2017.08.16
2017.07.25
2017.08.17
time stamps are there, see charts and prices in your terminal
I have a pose on the euro pound I am counting on 0.8980 then it bounces and I need to get out before thatEurobucks, too.
now how was it clear that short, by the timing
2017.08.16
2017.07.25
2017.08.17
time stamps are there, see charts and prices in your terminal
Not to get off-topic let's leave one prediction - from 7:00 on 21.08.2017 on EURUSD short position to ... (target?).
For the decision, 3 daily intervals for 3 instruments were taken into account - 2017.08.16, 2017.07.25, 2017.08.17 for AUDNZD, EURUSD,EURJPY(GMT ?)
Got it right ? GMT not necessary, but a target would be nice.
Added: Or take the whole price range from 2017.07.25 to 2017.08.21 ?
In order not to get off-topic, let's keep one prediction - from 7:00 on 21.08.2017 on EURUSD short position to ... (target?).
The 3 daily intervals for 3 instruments - 2017.08.16, 2017.07.25, 2017.08.17 for AUDNZD, EURUSD,EURJPY(GMT ?) were considered for the decision.
Got it right ? GMT not necessary, but a target would be nice.
Added: Or take the whole price range from 2017.07.25 to 2017.08.21 ?
I indicated the time when there was an entry signal
I plan to exit in the approximate range of 1.12-1.13
but could also drop to 1.09 or not lower than 1.1350, there are 2 levels there too
I have indicated the time when the entry signal appeared
the eurodollar target is hard to say
I plan to exit in the approximate range of 1.12-1.13
But it may fall to 1.09 or even lower than 1.1350.
Then with a small margin take 1.14 (not a bad forecast as it is). And I take the entire price range 2017.07.01-2017.08.21 for AUDNZD, EURUSD, EURJPY with emphasis on 2017.08.16, 2017.07.25, 2017.08.17.
I'll try not to be missing a reply. Thanks for getting involved :)
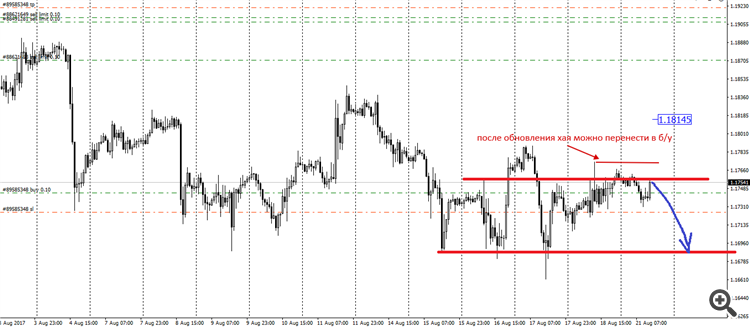
Fasten your seatbelts, we're going to go down)))
My view of the market is not a signal for action.
the whole layout is in the picture, nothing to add
Strap in, we're going to fly down)))
Excuse me, why do we have to fly down?
I beg your pardon, but why should we fly down?
Does it look like a possible reversal?