You are missing trading opportunities:
- Free trading apps
- Over 8,000 signals for copying
- Economic news for exploring financial markets
Registration
Log in
You agree to website policy and terms of use
If you do not have an account, please register
Come on, you're trying to find unrealistic things ))))) If everyone knew where the trend starts and where the flop starts ))))
Well it's not a problem anymore, I've got that sorted out. ))) It is enough to compare the direction of the channel (purple line), long term trend (dark line) and horizon. Set boundary conditions and we obtain excellent trend and flat signals. Now we only need to find appropriate stochastics for the channel and trend.
Well that's not a problem any more, I've sorted it out. ))) It is enough to compare direction of channel (purple line), long term trend (dark line) and horizon. Set boundary conditions and we obtain excellent trend and flat signals. Now we only need to find appropriate stochastics for the channel and trend.
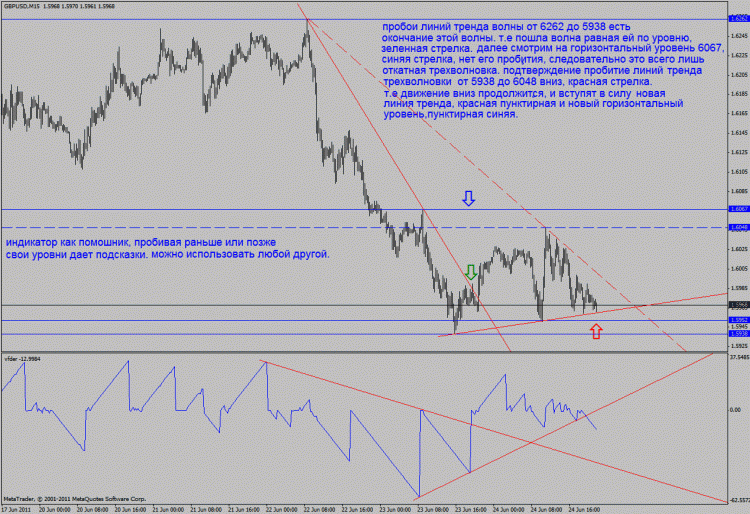
Greetings all! The most proven, accurate, after the price of course, indicator is a simple trendline and horizontal level! Everything else is secondary. I swear on the relics of Christopher Columbus it's true, otherwise it's false!
Like this?
You can do it the way you do it if it gives you an understanding of the price movement. I am doing it as shown in the screenshot.
The task is very simple - to identify local price reversal points. In fact, it is the potential entry points into the market (they just need to be filtered by the rules of TS).
So, I have not found a suitable indicator, that would help us clearly identify such points. The figure shows the adaptive fractal average in blue, the channel zigzag in purple and linearly smoothed 1st derivative of the fractal average (i.e., the rate of change of the fractal average) in green. Vertical lines at the intersection with the blue and green chart form extreme points of price fluctuations (these are almost entry points).
The chart becomes jerky - there are a lot of false signals. When smoothing it lags a lot. I cannot find the "golden mean" when the points do not lag too much and there are not so many false signals. Do you think some other indicators may be required to determine the entry points?
There's nothing complicated about it. There are few tools - trend lines, rays, channels (repetitions of previous impulses). If you don't want to think about it yourself, read T. Demark and J. Schwager (full course of technical analysis).
If that were really the case, there would be no market but only millionaires....))))
If it were really so, there would be no market but only millionaires....))))
I agree that I have been thinking. But that does not mean thinking about pivot points, because you do not need to know how to identify pivot points to make money. Because identifying pivot points and making money are slightly different things. Or rather, you don't need to know how to identify pivot points to make money. And vice versa. In order not to make money - you need to give a person an unsolvable task, namely the task of how to determine these mysterious pivot points.....))))