Spread trading in Meta Trader - page 252
You are missing trading opportunities:
- Free trading apps
- Over 8,000 signals for copying
- Economic news for exploring financial markets
Registration
Log in
You agree to website policy and terms of use
If you do not have an account, please register
Information for reflection:
Swiss franc-Japanese yen, February prospects
FX trading enthusiasts will be interested in the promising seasonal pattern described below. Approximately since the beginning of the second decade of February it is possible to estimate buying spreads of CHFJPY - CHFJPY March futures contracts, BUY 6SH4 - SELL 6JH4 = 1^1 (or single purchase of CHFJPY currency pair). A graph of multi-year averaged seasonal (3-5-10 years) trends (not including last year 2013) is shown in the figure below:
The spread (and consequently the currency pair CHFJPY) is expected to rise until the first days of the last decade of the current February-month. A statistical table of this entry in the analysed time horizon over the last thirteen years (also excluding last year) is shown in the figure:
The statistics figures are satisfactory enough to assess the technical possibilities of buying the spread, or the currency pair of the same name in the MT4 trading platform. Last year's rebound was unsure, but also ended in a tiny profit. The current situation of the "currency version" of the analyzed entry is shown in the chart below. In the past week the pair finished its long-term decline and even hinted at a UP reversal:
Perhaps for further work it will be advisable not to get into long-term seasonal long positions, but to work short-term (by our seasonal standards) into buying CHFJPY on price pullbacks. Using the simplest, standard technical analysis (support/resistance lines, channels, reversal patterns, customary oscillators, etc.) on small timeframes H1-H4. And, of course, by monitoring the release of significant economic news of the forex calendar, which may affect the movement of the pair CHFJPY. As a reminder, the main fundamental data regarding Japan is released around 3:00-10:00 Moscow time. And for Switzerland (as well as Eurozone), it is usually in the afternoon, from 13:00 to 17:00 Moscow timeframe.
Source: https://panteon-finance.com/analytics/view/shvejcarskij_frank__japonskaja_iena_fevralqskie_pe rspektivy
I've looked at seasonal movements, yes, there are some, although they are usually counter-trends, but that's not the point. I wanted to tell you about the indicator with crossed lines, it is not very useful, it is much easier to use levels for inputs
---------------------
Copper, February-March (HG)
Industry analysts anticipate that the supply of base metals will increase at a faster rate than the increase in demand this year. Specifically for copper, the surplus is expected to increase almost threefold compared to last year, 2013, driven by a forecast 4.9% increase in global production in 2014 (- data from Barclays Plc.)
At the moment, however, the medium-term seasonal up-trend of the instrument continues in the world's major markets:
The well-known English-language MRCI website provides statistics on the current buying of copper (ticker HG) through the first few days of April. According to this data, thirteen profitable entries have taken place over the last fifteen years in the analyzed time interval! This is what the graph of the average multi-year seasonal (5 and 10 year) trends of the May copper futures contract HGK4 looks like:
For exchange traded accounts, a different seasonal pattern for this instrument would be more interesting. Since late second to early third decade of February, calendar spread of copper HGK4-N4 (May-July) contrary to direction of single contracts - is oriented to decrease until early second decade of April-month! Let's take a look at the averaged multi-year charts (3-5-10 year) of seasonal trends:
http://seasonal-traders.com/stats/#stat?HGK2014-HGN2014?2014-02-17?2014-04-10?Sell
Spread sales statistics for the last 13 years are given in the table above under the chart (1 tick = 0.0005 and sost. $12.5 on the HG scale). No comment.
Note, the seasonality of the earlier spread HGH4-K4, announced in our previous reviews, worked out quite satisfactorily as well. Let me remind you that in the well-known exchange platform CQG, the analyzed spread HGK4-N4 is set by the ticker CPES2K4.
Good luck to all!
Source: https://panteon-finance.com/analytics/view/medq_fevralq-mart_hg_
This overview - will be useful for lovers of seasonal currency trading. GBP/CHF
There will be some important economic news today, February 19, that might affect the movement of the above mentioned currencies. Britain will release a block of labor market data (changes in benefit claims, jobless claims, unemployment rate...) and the Bank of England's latest monetary policy meeting minutes. A little later in Switzerland - release of Swiss Investor Expectations Index by ZEW and Credit Suisse.
In addition, currently since the end of the second decade of February there is a curious annual spread pattern of the June GBP-SCHF futures contracts, 6BM4 - 6SM4 = 1^1 (the spread corresponds to the currency pair GBPCHF). On a graph of multiyear averaged seasonal (three, five and ten years) trends, this pattern can be seen as follows:
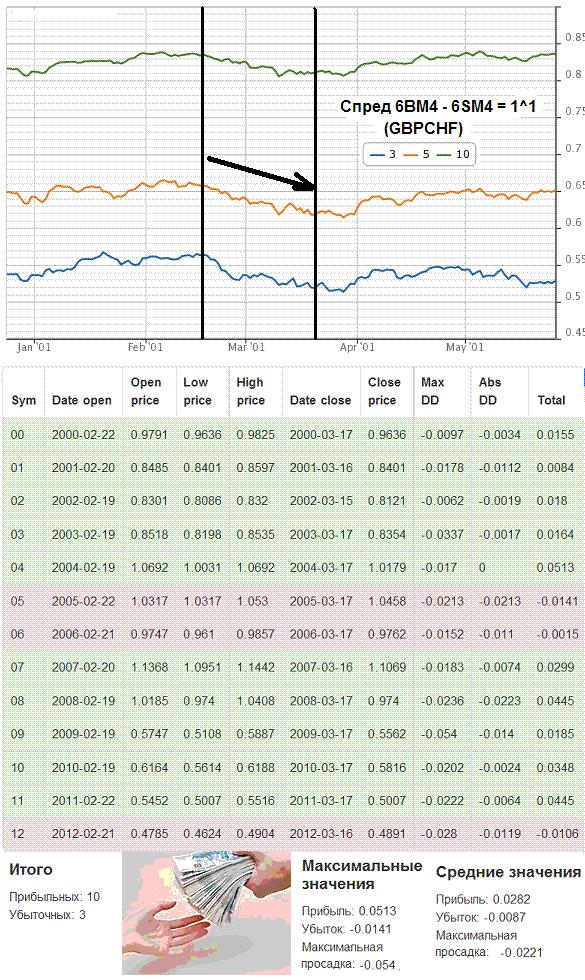
Until about the middle of the next, March-month, there is a decline in the GBPCHF instrument. Sales statistics (not including the last year 2013) for the last thirteen years in the specified timeframe - also confirms the analyzed seasonal trend! The number of profitable entries(+10/-3) and the average profit/loss ratio(+282 points/-87 points) are quite appropriate. In the previous year 2013 it was not quite a strong performance, but it still occurred, though with a very small profit! The current GBPCHF cross is shown on the chart:
We assume that it is better to work short-term here (by our seasonal standards) to sell GBPCHF on a pullback of the price. Using the usual standard technical analysis on small H1-H4 timeframes.
Source: https://panteon-finance.com/analytics/view/gbpusd_chfusd_fevralqskie_perspektivy
===============
Precious metals (gold, platinum...), February-March.
The precious metals (gold and silver), reacting to some strengthening of the dollar, continued their decline yesterday, February 19, after hitting a local high at the end of last week. Strong economic data is expected today (US labour market, business and manufacturing activity indexes), which may weigh on the dollar and hence on the precious metals' prices.
Meanwhile, according to seasonality, long-term declines in precious metal prices usually start from the end of the second to the beginning of the third decade of this month after the seasonal rise in February. Below is a graph of multi-year average trends (five- and fifteen-year trends) for April gold futures contract GCJ2014:
It is interesting to note that in the current year of 2014, the seasonality of gold (and other precious metals) has been observed with "commendable" consistency. Since the first days of February, prices have steadily started to rise. And at the moment, as if by "seasonal whistle", a Down-turn is clearly on the way. This can be clearly seen on the chart of XAUUSD, H4 - above.
To minimize risks during the seasonal sales of precious metals on the exchange deposits, so-called arbitrage entries attract attention - on the intermarket spreads of precious metals! For instance, gold-platinum (April contracts). The standard exchange ratio of these instruments spreads looks as follows: GCJ4 - PLJ4 = 1^2. If we take a chart of multiyear averaged seasonal (5, 15 and 30 years) trends, we will notice that the main Down-movement takes place approximately from February 23 - to the middle of the first decade of the next month, March:
SELL GCJ4 - BUY PLJ4 = 1^2 spread statistics in the given period over the last 13 years - looks quite satisfactory! And finally, let's open the current chart and estimate the situation with the analyzed spread at the moment:
After the local maximum of February 17 the spread GC-PL=1^2 is in the active flat. Perhaps, there is a reason to assess the situation since the end of the week and look for technical opportunities for seasonal sales of this "arbitrage" instrument. In the MT4 trading platform we can take any available versions (contracts) of spread instruments.
Good luck to all!
20.02.2014
Source: https://panteon-finance.com/analytics/view/dragmetally_zoloto_platina_serebro_
Sugar and spreads (March outlook)
Sugar prices usually start their seasonal decline with the first decade of March, especially the last days of March! It is the time when the harvesting of sugar cane plantations in South America begins. And in anticipation of the next big deliveries of the instrument, the market prices naturally start to fall. The figure below shows graphs of multi-year averaged seasonal (3-5-10 years) trends of SBK4 sugar futures contract (New York branch of ICE-platform) in May:
The chart clearly shows that the multi-year averaging lines are steadily declining until the last days of April, i.e. almost until the FND expiry day of the May contract! The instrument's sales statistics for the last thirteen years (shown in the chart above under the seasonal chart) for the next few weeks also look pretty convincing! Last year's breakout in the analyzed period (shown by the blue price line) was over 50 ticks!
The weather conditions in the "sugar" regions of Brazil are currently favourable for the final ripening of the crop. There were rains this past weekend and forecasters are also predicting favourable conditions in the days ahead. Weather conditions in other major "sugar" regions of the world are also rated as "good"!
Of some concern is the unstable "pre-war" situation in Russia and Ukraine as both countries are important sugar beet producers! Further military escalation in the region could lead to an increase in global sugar demand. This factor, before deciding to enter the market, should be taken into account in a mandatory manner!
In conclusion let's note that for decrease of risk and increase of reliability of profitable result on exchange accounts, it is possible to estimate prospects of sales of calendar sugar spreads in various contract combinations: SBK4-N4, SBN4-V5 etc. Good luck to all!
===================================
Source: https://panteon-finance.com/analytics/view/saxar_i_saxarnye_spredy_martovskie_perspektivy
Fragment of the raw materials review:
--------------------------------------------
... ... ... Over the weekend (8-9 March), OPEC crude oil production statistics for the previous month were released on global newswires. It was noted that February marked the highest monthly production since August 2013! Production rose by 240,000 barrels per day (to 30.11 million bpd)! Commodity analysts also note an increase in North American oil production as well as an increase in Iranian export shipments via its southern ports.
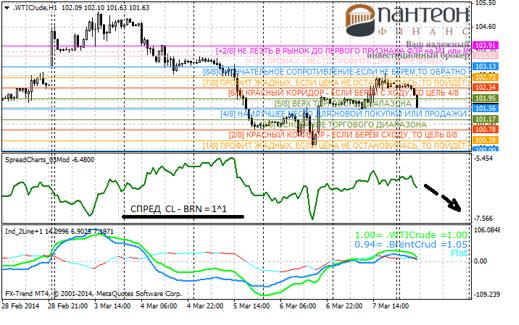
It is anticipated that these factors may put pressure on commodity prices this week and, consequently, cause them to fall.
We should add that Light Sweet (CLK4) - Brand (BRNK4) spread by its seasonality since second decade of March also suggests long-term, till end of first decade of April, - decrease.
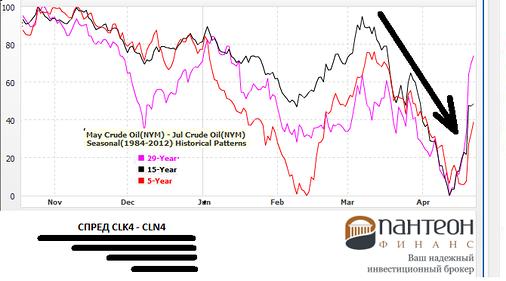
For those who like arbitrage trading we suggest to pay attention to the calendar spread of US Light Sweet CLK4 - CLN4 (May - July). From the end of the first - beginning of the second decade of the current month, the spread tends to a long-term decline, - until the second decade of the next month, April:
The figure above shows a graph of the averaged multi-year seasonal (20-15-5) trends CLK4-N4! The estimated average profit potential in the analyzed time interval is - more than +100 ticks (points) on the CL scale! However, here below is a statistical spread sales table for the last 13 years. No comment.
Source: https: //panteon-finance.com/analytics/view/neftq_martovskie_perspektivy_
Currency market, GBP/CHF ( Spread 6BM4 - 6SM4, - March outlook)
The end of the first quarter is approaching and European countries are approaching the deadline for paying annual taxes and filing tax returns for the past year 2013. It is the specifics of the tax laws of various countries during the current period that often determine the direction of various currency pairs.
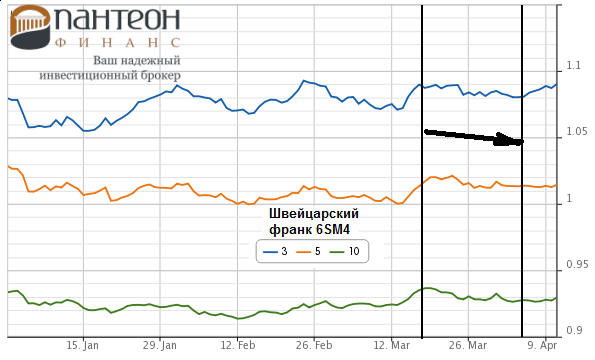
For instance, since the middle of the second decade of March, demand for Swiss franc futures contracts starts to fall markedly, see graph for the average multi-year seasonal trend of the June 6SM4 contract:
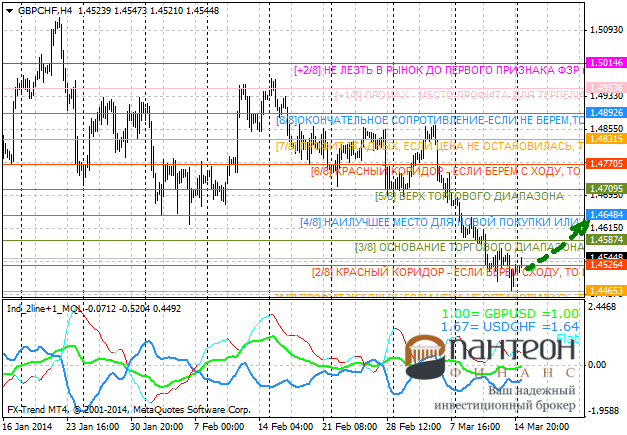
In this regard, specialist seasonal websites note that there is a useful seasonal pattern for the GBP-Swiss franc currency pair from the end of the second to the beginning of the third decade of March! Demand for GBP almost till the end of the first decade of next month - April is significantly higher than demand for CHF! Below - seasonal 3-5-7 year average charts of GBPCHF currency pair:
Transaction statistics ( GBPCHF buys) over the last fourteen years from March 19 to April 5 look good! There have been eleven profitable entries and only three losing ones. The ratio of average profit/loss is +271 points / -93 points on a four-digit scale for this currency pair. Thus, since the beginning of this week there is a reason to monitor the price movements of GBPCHF and look for an opportunity to buy the currency pair on small timeframes (H1-H4) within the day.
Since the instrument is rather volatile, it will be advisable to work with short-term buys on a pullback. Using in this case the means of standard technical analysis.
Source: https://panteon-finance.com/analytic...ie_perspektivy
Currency market, GBP/CHF ( Spread 6BM4 - 6SM4, - March outlook)
Approaching the end of the first quarter, and in European countries the deadline for payment of annual taxes and filing of tax returns for the past year 2013 is approaching. It is the specifics of the tax laws of various countries in the current period that often determine the direction of movement of these or other currency pairs.
For instance, since the middle of the second decade of March, demand for Swiss franc futures contracts starts to fall markedly, see graph for the multi-year average seasonal trend of the June 6SM4 contract:
In this regard, specialist seasonal websites note that there is a useful seasonal pattern for the GBP-Swiss franc currency pair from the end of the second to the beginning of the third decade of March! Demand for GBP almost until the end of the first ten-day period of next month - April is significantly higher than demand for CHF! Below - seasonal 3-5-7 year average charts of GBPCHF currency pair:
Transaction statistics ( GBPCHF purchases) over the last fourteen years from March 19 to April 5 look good! There have been eleven profitable entries and only three losing ones. The ratio of average profit/loss is +271 points / -93 points on a four-digit scale for this currency pair. Thus, since the beginning of this week there is a reason to monitor the price movements of GBPCHF and look for an opportunity to buy the currency pair on small timeframes (H1-H4) within the day.
Since the instrument is rather volatile, it will be advisable to work with short-term buys on a pullback. Using in this case the means of standard technical analysis.
Source: https://panteon-finance.com/analytic...ie_perspektivy
very interesting... but lately (probably for a year now...:-)) the pair has been strongly correlated with the euro, and if the euro jumps, one can expect a collapse...
This is just to be on the safe side - we should rather watch out for euro dynamics...