Spread trading in Meta Trader - page 245
You are missing trading opportunities:
- Free trading apps
- Over 8,000 signals for copying
- Economic news for exploring financial markets
Registration
Log in
You agree to website policy and terms of use
If you do not have an account, please register
Useful information for lovers of seasonal spread trading. Below are excerpts from the latest seasonal review I wrote on behalf of Pantheon-Finance on grain instruments:
Since the last days of June, the seasonal pattern of the intermarket grain spread between wheat and corn is clearly visible! By the end of June/early July the last maize planting is usually completed in the USA. Exchange traders' fears for this crop drop sharply and demand weakens. While wheat "prospects" are much more exposed to adverse weather conditions during this period. And stock speculators are somewhat more concerned about the fate of the future wheat crop!
All said is confirmed by the graph of the multi-year seasonal trends (3-5-10 years) of the spread of the September wheat-corn futures contracts ZWU3 - ZCU3 = 1^1
Note that despite seemingly reliable multi-year seasonal lines - last year the spread worked out "exactly the opposite"! From almost the first days of July the spread began to fall steadily:
However, this is explained (who remembers) by last year's abnormally severe summer drought in the grain belts in the USA in decades ! Cereal prices (especially feed cereals - maize, soybeans) went up sharply during all summer months! The seasonality of other crops (livestock, pigs) has also been disrupted.
So far this year there are no signs of abnormal natural phenomena. And we can hope that the spread will work out its July UP-seasonality quite satisfactorily!
For a more specific assessment of the expected seasonal movement, let's look at the complete buying statistics for the ZW - ZC = 1^1 spread from June 30 to August 3 over the past 13 years, for example:
Percentage of profitable trades(+9/-4), and average profit/loss ratio = +213 (53.25*4)ticks /69 (17.25*4)ticks look quite satisfactory! However...
The spread is rather volatile (that is clearly seen in the picture below) and it is reasonable to work in buying here - short-term (by our seasonal measures) buy entries, - on the pullbacks! Using to determine the optimal entry/exit points means of standard technical analysis on small (again, by our standards) timeframes (M30-H4). The current situation is shown on the chart:

On Friday night, after the release of the next USDA crop report- the spread has already attempted a small increase! Let's see how the July ZW-ZC seasonality works out for the current year 2013!
Congratulations to those who took advantage of the recommendation to buy the wheat-corn spread! So far everything is going "normal"! The ZW-ZC spread is rising seasonally with confidence!
Useful information for lovers of seasonal and spread trading. Below are excerpts from the latest seasonal review I wrote on behalf of Pantheon-Finance on commodity instruments:
----------------------------------------
English-language seasonal websites have been recommending getting into timber sales since the first days of this month!
Let me remind you that timber is traded mainly on Canadian exchanges. For Canada, timber harvesting is an industry of international specialisation. The country is the number one exporter of timber products. Most of the lumber produced in the United States comes from the Pacific coast, from the Northwest. Douglas fir is the market leader in lumber and grows primarily in Oregon, Washington and northern California.
An actively traded lumber futures contract with the ticker symbol LBS (LB, LS) runs through the Chicago Mercantile Exchange(CME).
According to last year's recommendation of the well-known English-language seasonal website MRSI, seasonal sales of the instrument are expected until about the middle of the 20th of the month:
According to the MRSI version there have been fourteen profitable sales in the last 15 years (not including last year)! The average profit in that time frame was $1139 per LBS contract!
Let's look at a chart of the multi-year seasonal trends (3-5-10 years) of the September LBSU3 timber futures contract:
Indeed, the averaged multi-year lines clearly show the Down-trend of the instrument from about the middle of the first decade of July! The blue price line shows a somewhat awkward, but still profitable, last year's performance of the instrument in 2012.
For the "inquisitive reader" let me remind you that we put the annual movement of the instrument LBSU2 for the last years in the analyzed time interval last year at: http://procapital.ru/showthread.php?t=41813&page=62&p=1264725&viewfull= 1#post1264725
But for a more specific assessment of the supposed seasonal movement, let's look at the full statistics of timber sales, for example, from July 8 (took Monday for "even count") to July 26 for the last 13 years:
The percentage of profitable trades(+12/-1) as well as the average profit(+137 ticks, 1 tick=$11 per contract) look quite satisfactory!
Only one year 2004 looks sharply unprofitable. Even its statistics is abnormal! Now it is difficult to say why it happened in that distant 2004? Perhaps there was a "total" outbreak of forest fires. Or an infestation of parasitic bugs (it happens!). But this year of 2013 no anomalies are expected yet! So, we have hope for a positive outcome to the anticipated seasonal sale!
To illustrate this, let's look at the average probability of the LBS price direction for each day of the current month for the last 15 years (not including the last year 2012). The graph is very interesting:
We can clearly see that from the first days of the next week there is a high probability (up to 73%) of the beginning of the Down movement of the instrument!
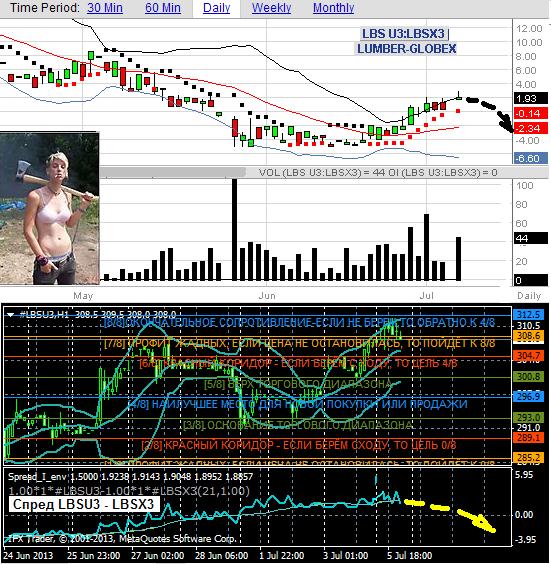
The current situation of LBSU3 (tf=H4) is shown in the figure below. Interestingly, in the current year of 2013, the timber is observing its seasonality with surprising obedience! I have purposely displayed the seasonal (reduced) multi-year chart again on the bottom right so that our readers can be convinced of this "without leaving the cash register" so to speak (the movements are shown by arrows)!
So, we are looking forward to the beginning of next week to further evaluate the situation for the sales of the instrument LBSU3!
However, for those who wish to minimize possible drawdowns when trading this instrument, we can recommend to engage the calendar spread of LBSU3 - LBSX3near-term futures contracts, September - November.
Let's look at the graph of the averaged multiyear seasonal trends (5 and 15 years) of the spread in the analyzed time interval:
The seasonality of the spread looks quite attractive! The bottom chart shows a very decent last year's seasonal performance of the LBSU2-X2 spread!
Following established practice and for a more specific assessment of the estimated seasonal movement, let's look at the full sales statistics of the analyzed LBSU3-X3 wood spread, for example, from July 8 to July 26 for the last 13 years:

The percentage of profitable trades(+12/-1) as well as the average profit(+57 ticks, 1 tick=$11 per spread contract) look quite satisfactory! But, as in the single entry statistics, only one 2004 looks sharply unprofitable. However, once again, it seems that no natural anomalies (which could severely affect the seasonality) are expected this year, 2013! So, already from Monday we closely monitor the current situation on the spread chart!
So, from Monday we will closely monitor the current situation on the spread chart LBSU3-X3! The current situation looks like this (Daily and H1 spread charts):
The spread is now at its local maximum (as well as a single instrument). And, as if it has "thought about it" - isn't it time to start seasonal reversal? It should be noted that spreads LBSU3-X3 - illiquid, and on very small market deposits, and also without good skills to work with such illiquid spreads (wood, oats, rice, etc.) it is better to wait for clear, clearly-obvious signs of price reversal on higher rates. And then make a final decision to enter the market!
The trading on the CME market for LBS timber on Mondays usually starts after 17:00 Moscow. Good luck to all!
great! The only problem is that you can't make ten thousand percent a year by seasonal spread trading((((
And what kind of trade can you make thousands of percent?
And what kind of trading can you do to earn thousands of percent?
Arbitrage. Not quasi )
By the way, I was worried about your PAMM almost as if it was my own. Although... I didn't quite understand why you didn't stop in time.
There are moments there :) when it is hard not to make money.
I've probably made more of a mess on this one than in the six months of trading before. Well, as a result I ended up with a logical loss in gold/silver with no stops.
Probably, I will try again soon with almost or all automatons. We will see.