Online trading on Wave Theory (NIROBA method) - page 379
You are missing trading opportunities:
- Free trading apps
- Over 8,000 signals for copying
- Economic news for exploring financial markets
Registration
Log in
You agree to website policy and terms of use
If you do not have an account, please register
That's the thing - this monthly Fib of 61.8 has already been breached - so it looks like we're still going down.
In any case - thanks for the alternative scenario, which I did not pay attention to for the time being. And I will move my stops closer.
http://img404.imageshack.us/img404/2102/eurd1.gif
As much as we would like to be in the third wave, but unfortunately or fortunately I can say that it has not started yet. The MACD move to the plus signifies the end of the whole falling wave from the level of 1.51 and most likely, this is only the first wave. At the moment the second wave is in progress.
Eura wickly. Take a look at the line chart of the euwerkli (last 4 weeks' segment) and there is a clear three-wave structure visible at the moment - finished or not it is a question of this week, but note the MA100 and the neckline - it is a strong possibility that the euw has finished only the first wave of decline and not the whole decline.
http://img693.imageshack.us/img693/8586/eurw1.gif
Euras H4
http://img3.imageshack.us/img3/567/eurh4.gif
let's see ALT_3 (I will put it in order after the full confirmation)
Since we are in a higher order wave (2) than previously thought, in which case we need a breakdown/piercing of the upper line. The reversal targets are 1.2730, but before the (3)-event they might make a false move up by a couple hundred pips (a long intraday spike for instance).
GBP H4:
http://img638.imageshack.us/img638/4549/gbph4.gif
Alexey, good afternoon!
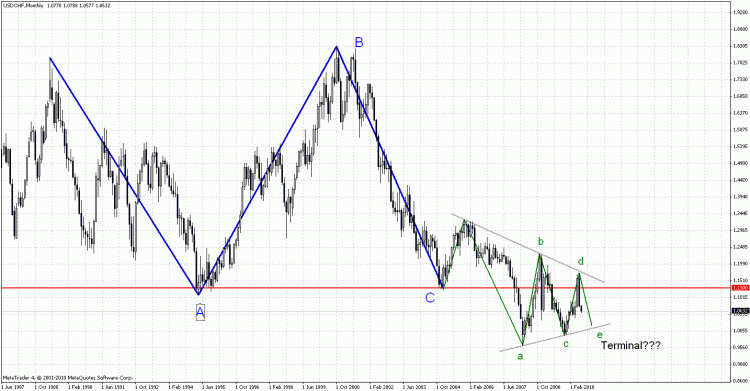
I started to discuss the terminal with my colleagues and I accidentally took a look at the clean charts of the chiff... and this is what I came to:
What do you think??)))As for me, the option is very symmetrical so far)))What are the pros and cons?... If the marking turns out to be correct, the eurik will not be fun))))
Alexey, good afternoon!
I have started to discuss the terminal with my colleagues and I accidentally took a look at the clean chart of the chiff... and this is what I came to:
What do you think??))) As for me, the option is very symmetrical so far))) What are the pros and cons?... If the marking turns out to be correct, the eurik will not be fun))))
Pavel, here is the chart on VP. Dollar-Franc since the beginning - since 1971, when the forex market came into existence.
History of franc quotes in appendix If you load the quotes in the metaque and make a markup, the picture will change. :))
http://img29.imageshack.us/img29/5281/gbph1.gif
Eur H1:
http://img651.imageshack.us/img651/6206/eurh1.gif
http://img29.imageshack.us/img29/5281/gbph1.gif
Eur H1:
http://img651.imageshack.us/img651/6206/eurh1.gif
I agree with both the euro and the pound :)
The only thing waiting for us after the euro reaches 1.2730 is not clear ... there are 2 options
1 - Either a new impulse wave downwards with a breakdown of the bottom
2-or another three-wave correction to the whole structure and a new impulse wave C to the area of +- 1.32 ...
let's see...:)
I don't believe in your fibs and waves, I don't understand why you believe in them so much. here's my chart.
blue goes to heaven, red goes to hell, we've been going to hell for a month now and we have to get there before we turn blue :-)
daily
clockwork
it's like two elder screens. yellow vertical lines the beginning of the month, red the beginning of the week, blue the beginning of the day
no one can tell me why this 5-3 wave structure... it's not provable, you take it as an axiom...
I agree with both the euro and the pound :)
The only thing waiting for us after the euro reaches 1.2730 is not clear ... there are 2 options
1 - Either a new impulse wave downwards with a breakdown of the bottom
2-or another three-wave correction to the whole structure and a new impulse wave C to the area of +- 1.32 ...
let's see... :)
I don't believe in your fibs and waves, I don't understand why you believe in them so much. here's my chart.
blue goes to heaven, red goes to hell, we've been going to hell for a month now and we have to get there before we turn blue :-)
daily
clockwork
it's like two elder screens. the yellow vertical lines are the beginning of the month, the red the beginning of the week, the blue the beginning of the day.
no one can tell me why this 5-3 wave structure... it's not provable, you take it as an axiom...