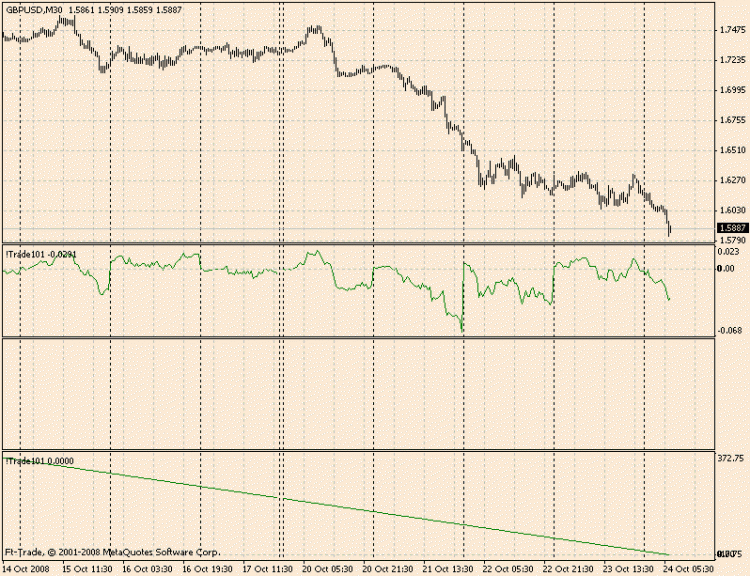
Trade101 multi-currency indicator


Here's the multi-currency turkey. Its task is to order the pairs by the number of pips, relative to the start of the day.

It displays perfectly well when just showing the value of pips. But when I try to display the sequence number in the array, I get a problem.

I have highlighted the place in the code where you can observe this.

//+------------------------------------------------------------------+
//|                                                        Multi.mq4 |
//|                                Copyright © 2008, Сергеев Алексей |
//|                                         mailto: urgunt@gmail.com |
//+------------------------------------------------------------------+
#property copyright "Copyright © 2008, Сергеев Алексей"
#property link      "mailto: urgunt@gmail.com"

#define Max 2

#property indicator_separate_window
#property indicator_buffers 1

#property indicator_color1 Green
#property indicator_width1 1
#property indicator_level1 0.0

double Buf[];
//+------------------------------------------------------------------+
int init()
{
	SetIndexBuffer(0, Buf); SetIndexStyle(0, DRAW_LINE); return(0);
}
//+------------------------------------------------------------------+
int deinit() { return(0); }
//+------------------------------------------------------------------+
int start()
{
	string Pair[ Max]; // сохраняем имена валют для удобства в массив
	Pair[0]="EURUSD"; Pair[1]="GBPUSD"; 
   double Price[ Max][2];
   
	int bar0, bar1; string str; datetime time0, time;
	int i, j, k;
	double pc0, pc, a;
	bool b=true;
	
	// нашли минимальное число баров
	for ( i=0; i<Bars-1; i++) //составяем график
	{
		time=iTime(Symbol(), 0, i); // берем время бара текущего графика
		// синхронизируем текущую цену закрытия
		k=0; bar1=0; while ( k< Max && bar1!=-1)  { bar1=iBarShift( Pair[ k], 0, time, true);  k++; }
		if ( bar1==-1) continue; // если её нет на всех валютах, выходим

		str=TimeYear( time)+"."+TimeMonth( time)+"."+TimeDay( time);	time0=StrToTime( str);
		// синхронизируем полуночный бар
		k=0; bar0=0; while ( k< Max && bar0!=-1)  { bar0=iBarShift( Pair[ k], 0, time0, true);  k++; }
		if ( bar0==-1) continue; // если его нет на всех валютах, выходим

		// синхронизируем цену закрытия полуночного бара
		k=0; pc0=1;	while ( k< Max && pc0!=0)  { pc0=iClose( Pair[ k], 0, bar0+1);  k++; }
		if ( pc0==0) continue; // если её нет на всех валютах, выходим
		
		for ( j=0; j< Max; j++) // получили значеня цен всех пар текущего бара
		{
			bar0=iBarShift( Pair[ j], 0, time0, true); bar1=iBarShift( Pair[ j], 0, time, true);
			Price[ j][0]=iClose( Pair[ j], 0, bar1)-iClose( Pair[ j], 0, bar0+1); // сохраняем число пунктов
			Price[ j][1]= j; // сохраняем индекс сивола в массиве
		}
		while ( b) // сортируем массив по возрастанию
		{
			b=false;
			for ( j=1; j< Max; j++)
				if ( Price[ j][0]> Price[ j-1][0])	
				{ 
					a= Price[ j][0]; Price[ j][0]= Price[ j-1][0]; Price[ j-1][0]= a;
					k= Price[ j][1]; Price[ j][1]= Price[ j-1][1]; Price[ j-1][1]= k; b=true; 
				}
		}
		//----------- ВОТ В ЭТОЙ СТРОЧКЕ ОШИБКА ------------------------------------|
		for ( j=0; j< Max; j++) Price[ j][0]= j; // заменили пункты на порядковый номер |
		// Если ее закоментировать, то будет выводиться просто число пунктов				|
		//--------------------------------------------------------------------------|
		if (GetLastError()!=0) Print("hsfjshdk");
		// строим график для текущей валюты
		for ( j=0; j< Max; j++)
			if ( Pair[ j]==Symbol()) // берем график текущего символа
			{
				for ( k=0; k< Max; k++) // находим в массиве её цену и порядковый номер
					if ( Price[ k][1]== j) 
					{
						bar1=iBarShift( Pair[ j], 0, time, true); // взяли смещение бара
						
						//---- ВОТ ТУТ СТРОИТСЯ ГРАФИК --------------
						Buf[ bar1]= Price[ j][0];
						// Buf[bar1]=15; // ВОТ ТАК график строиться ВООБЩЕ НЕ БУДЕТ
						// Buf[bar1]=i; // ВОТ ТАК будет строится НОРМАЛЬНО наклонная линия 
					}
				break;
			}
	}
	return(0);
}
 

In addition to the words, an explanatory picture


The first variant of the indent (from top to bottom, when the line is commented

for ( j=0; j< Max; j++) Price[ j][0]= j; // заменили пункты на порядковый номер |

Second variant, when it remained working

The third variant when the line is left working

// Buf[bar1]=i; // ВОТ ТАК будет строится НОРМАЛЬНО наклонная линия 
The variant when the working line is 
Buf[bar1]=15; // THIS IS NOTHING like this

the same as the second one.

By the way, I noticed that the name of the indicator is not written for the second variant - I have a feeling that there are errors such as division by 0.
 

And as for the indicator's dependence on 0 bar, it shows up on some timeframes. Sometimes the chart appears - just a horizontal line. But when you shift the chart so that the zero bar is not visible on the screen, it disappears!!!

I do not understand. I would be grateful if someone could point out the problem.

 
sergeev писал(а) >>

And as for the indicator's dependence on 0 bar, it shows up on some timeframes. Sometimes the chart appears - just a horizontal line. But when you shift the chart so that the zero bar is not visible on the screen, it disappears!!!!

I do not understand. I would be grateful to those who can show me the problem.

It is necessary to put in an indicator to control the number of bars on the second instrument. And when it changes by more than one, it redraws it completely. It means that there was a history swap.

 
Nope. Checking on already downloaded history with no internet connection.
 
Can anyone try to run it in their place?
 

Put it in a file. I don't want to copy it.

 
Files:
_trade101.mq4  4 kb
 
sergeev писал(а) >>

Buf[bar1]=15; // THIS IS NOTHING like this

1. If the range is fixed at 14:16, a horizontal line will be drawn. (The range automatically becomes 15:15 and ... everyone goes crazy :), I guess).

For the "original" version, the range is 0:2 and there will also be a line. (This is also what the debug print says).

2. I won't say anything about the sorting algorithm ;). I, in the same situation, preferred 2 arrays and ArraySort

 
SergNF >> :

1. If you fix the range at 14:16, a horizontal line is drawn. (The range automatically becomes 15:15 and ... everyone goes crazy :), I guess).

For the "original" variant, the range is 0:2 and there will also be a line. (This is also indicated by the debug print)

Exactly right. I missed it.

2. I won't say anything about the sorting algorithm ;). I, in the same situation, preferred 2 arrays and ArraySort.

ArraySort is not suitable. You need to sort two dimensions simultaneously. sort the digits and move the indexes at once.

 
sergeev писал(а) >>

Still, I was right when I gave the link to the T101 system.