Help with Fourier - page 6
You are missing trading opportunities:
- Free trading apps
- Over 8,000 signals for copying
- Economic news for exploring financial markets
Registration
Log in
You agree to website policy and terms of use
If you do not have an account, please register
ANG3110, you are going in the right direction, even right thinking, but you should forget about Fourier, it is not suitable for prediction. Here is a hint for further development of your theory, the smallest frequency in the frequency spectrum of your indicator (MinFreq) should be less than PI divided by the number of bars analyzed (BarsAnaliz). MinFreq = PI / BarsAnaliz. By Fourier MinFreq = 2*PI / BarsAnaliz, i.e. 2 times larger. And then think for yourself.
Thanks "great teacher" for the tip. Ha ha ha.
I hint that it's not an indicator, but a script, and I change the period by moving the mouse as I like and the number of harmonics, too. The rest, I repeat, one must be able to tune it, to see and understand the picture. It reminds me a little of tuning a receiver to a radio station. Which ratios to choose, i.e. how many bars (by the way, I don't use the concept of number of bars, everything is time-based and switching from timeframe to timeframe, the number of bars is calculated automatically, I've already started to forget what the number of bars is, for me it's time-based), it can be seen in the minimum of skewness relative to the Fourier lines and the maximum amplitude of the harmonic sum.
Forget about Fourier, well forget it, who's stopping you if it's not useful for you.
The Fourier transform only works correctly with stationary series. Absolute quotes are not stationary and contain a lot of noise.
In practice, it is advisable to track non-stationarity - along with calculating the spectrum, calculate its variance.
If the ratio of spectrum peak height dispersion to the value of this height exceeds a certain threshold, the spectrum peak is formed by non-stationaries and is not reliable, i.e. cannot be used for forecasting of quotation movement.
Thus based on spectrum dispersion you can detect unreliable spectra that cannot predict and most probably will confuse the picture, and vice versa - reliable peaks.
Try it...
It is true that the process is non-stationary. But it can be made relatively stationary given the nested cycles. As for forecasts, I've tried many methods in my time starting from power regression, adaptive divergences of different types up to "caterpillar-like" methods. But I like Fourier most of all. Where the market will go tomorrow or the day after tomorrow? Let's carry out several trials and get rid of "guessing by coffee grounds". At least the cycles work in the vast majority of cases. On Friday one of my acquaintances decided to leave an open order for EUR on Monday. I looked and said that the pullback would not start before Monday. But it might not have been.
Once upon a time, many, many years ago, I was accused of being addicted to astrology by citing my own writings in a very reputable book, only they didn't know that I had written it. So there I would have put these smart guys on the high seas for a few days fishing without radar, radio or even a compass. I would see where they would sail without taking into account the angle of the Sun, star gauges. Better yet, put them on Forex, and of course on a real account, I think getting clever and "teaching others" would immediately discourage them.
I wonder. Can I get a link to "writing in a very authoritative book"?
About the fishermen - are we talking about astrology or astronomy?
(If..., the answers can be private)
passing by...
The Fourier transform only works correctly with stationary series. Absolute quotes are not stationary and contain a lot of noise.
In practice, it is advisable to track non-stationarity - along with calculating the spectrum, calculate its variance.
If the ratio of spectrum peak height dispersion to the value of this height exceeds a certain threshold, the spectrum peak is formed by non-stationaries and is not reliable, i.e. cannot be used for forecasting of quotations movement.
Thus based on spectrum dispersion you can detect unreliable spectra that cannot predict and most probably will confuse the picture, and vice versa - reliable peaks.
Try it...
Interesting!
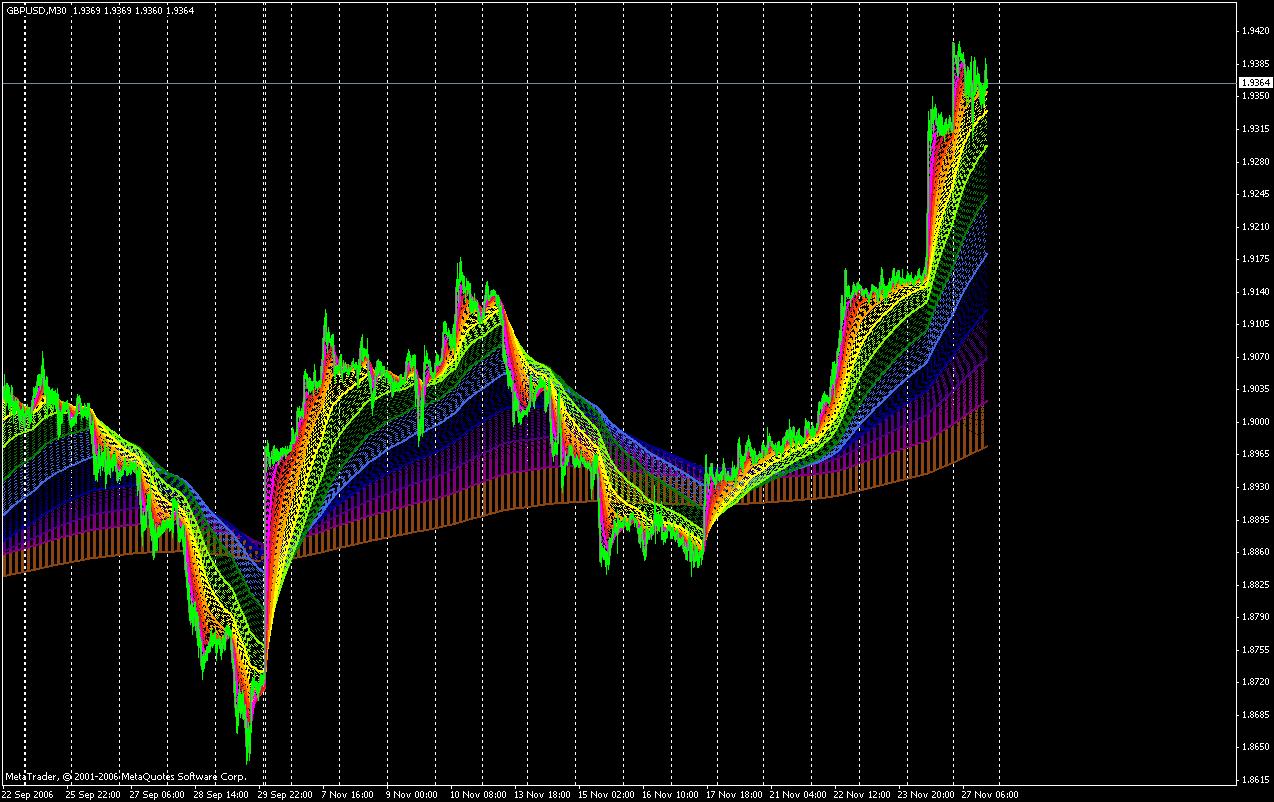
my time studying MUWINGS
I came up with this strange indicator, or rather a simple set of muwings
synthesizing them for all TFs
the set works perfectly in the flat
there was an idea to make it all through a fast Fourier transform
but I have not got to
Interesting!
In my time, when I was studying muwings.
came up with this strange indicator or rather just a set of muwings
by synthesizing them over all TFs
the set works perfectly in a flat
I had an idea to process it all through a fast Fourier transform
but I haven't got around to it
Interesting. Can I have a link to "writings in a very authoritative book"?
About the fishermen - are we talking about astrology or astronomy?
(if..., answers can be private)
I'll answer privately in my email, because we're talking about phenomena of extra-physical memory here... I'm not that old in terms of physical age.