Forum on trading, automated trading systems and trading strategy testing
Indicators: Tick indicator ZoomPrice
fxsaber, 2016.11.01 21:51

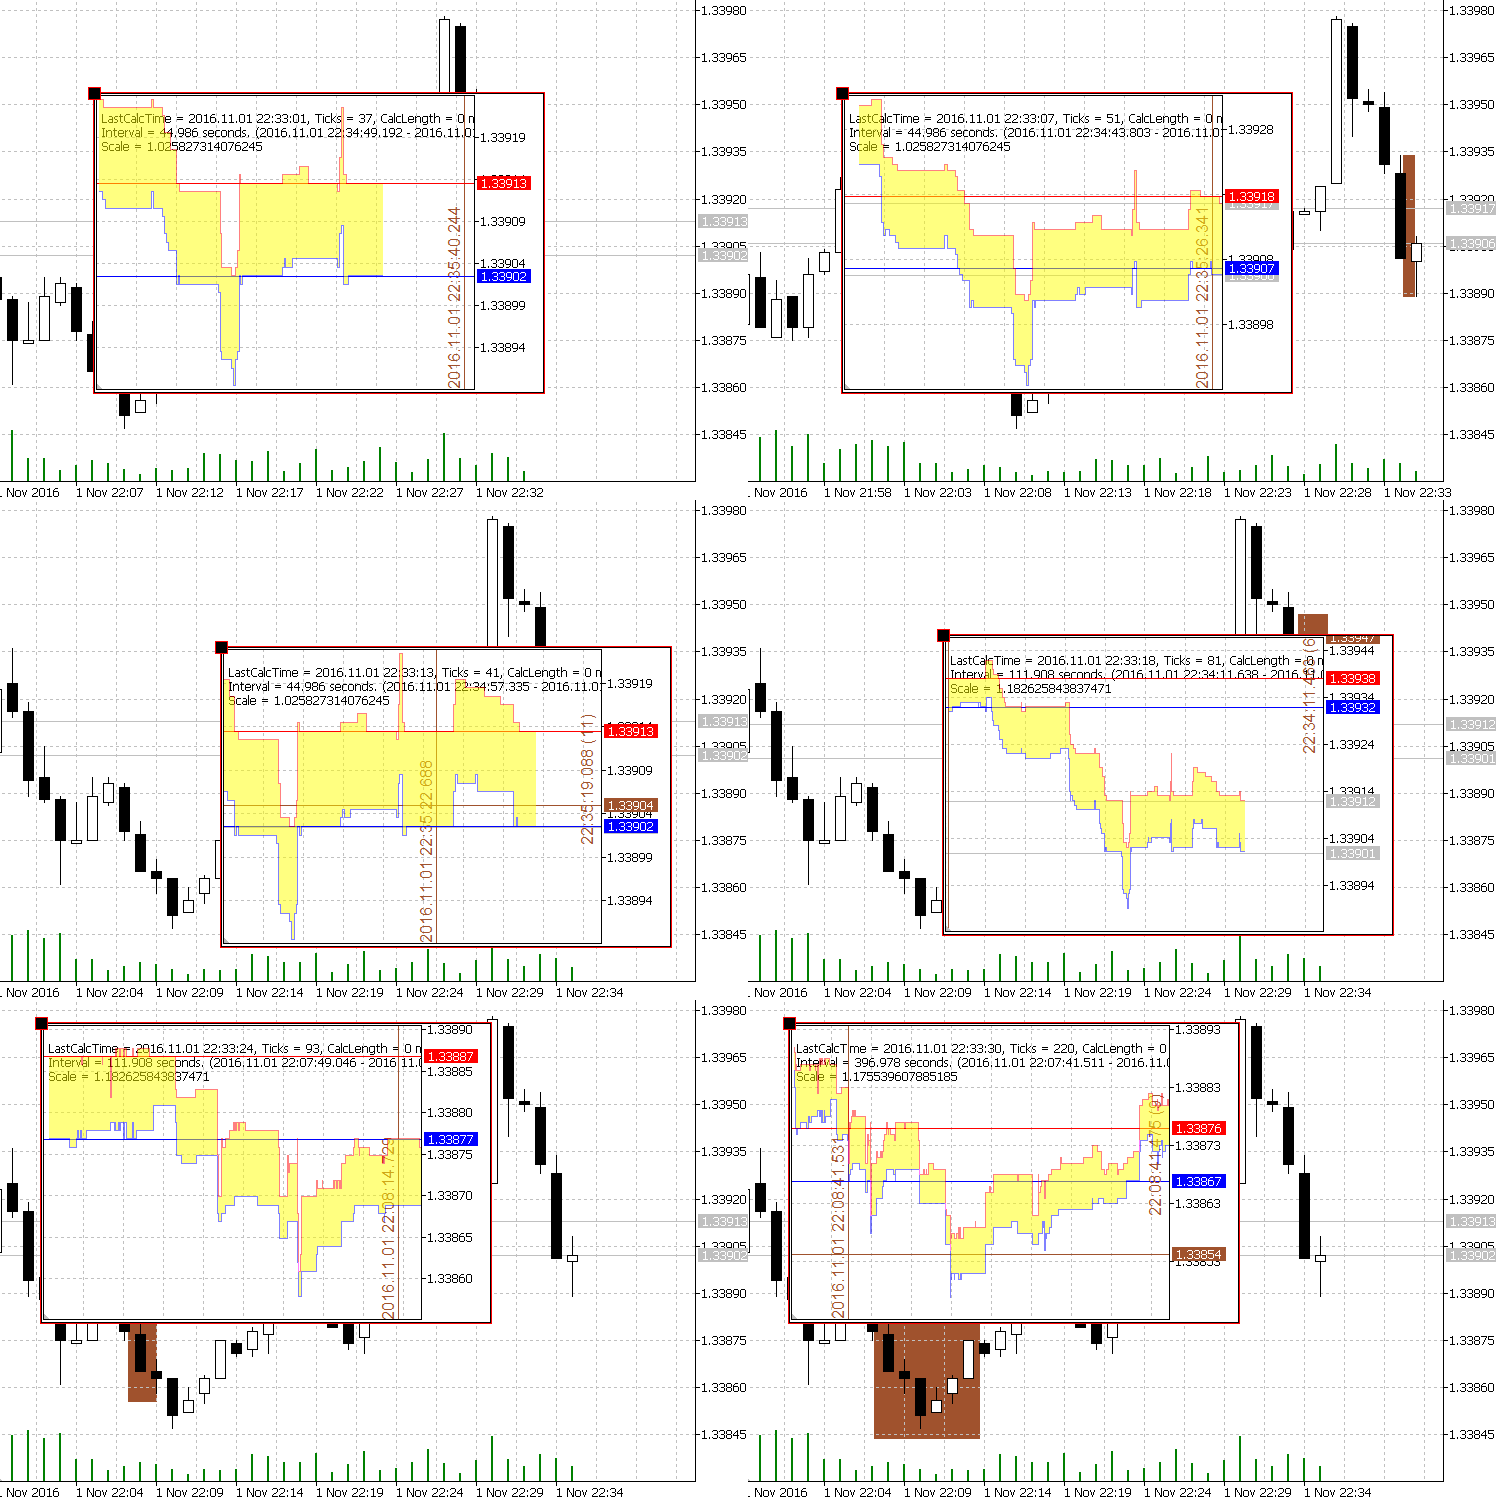
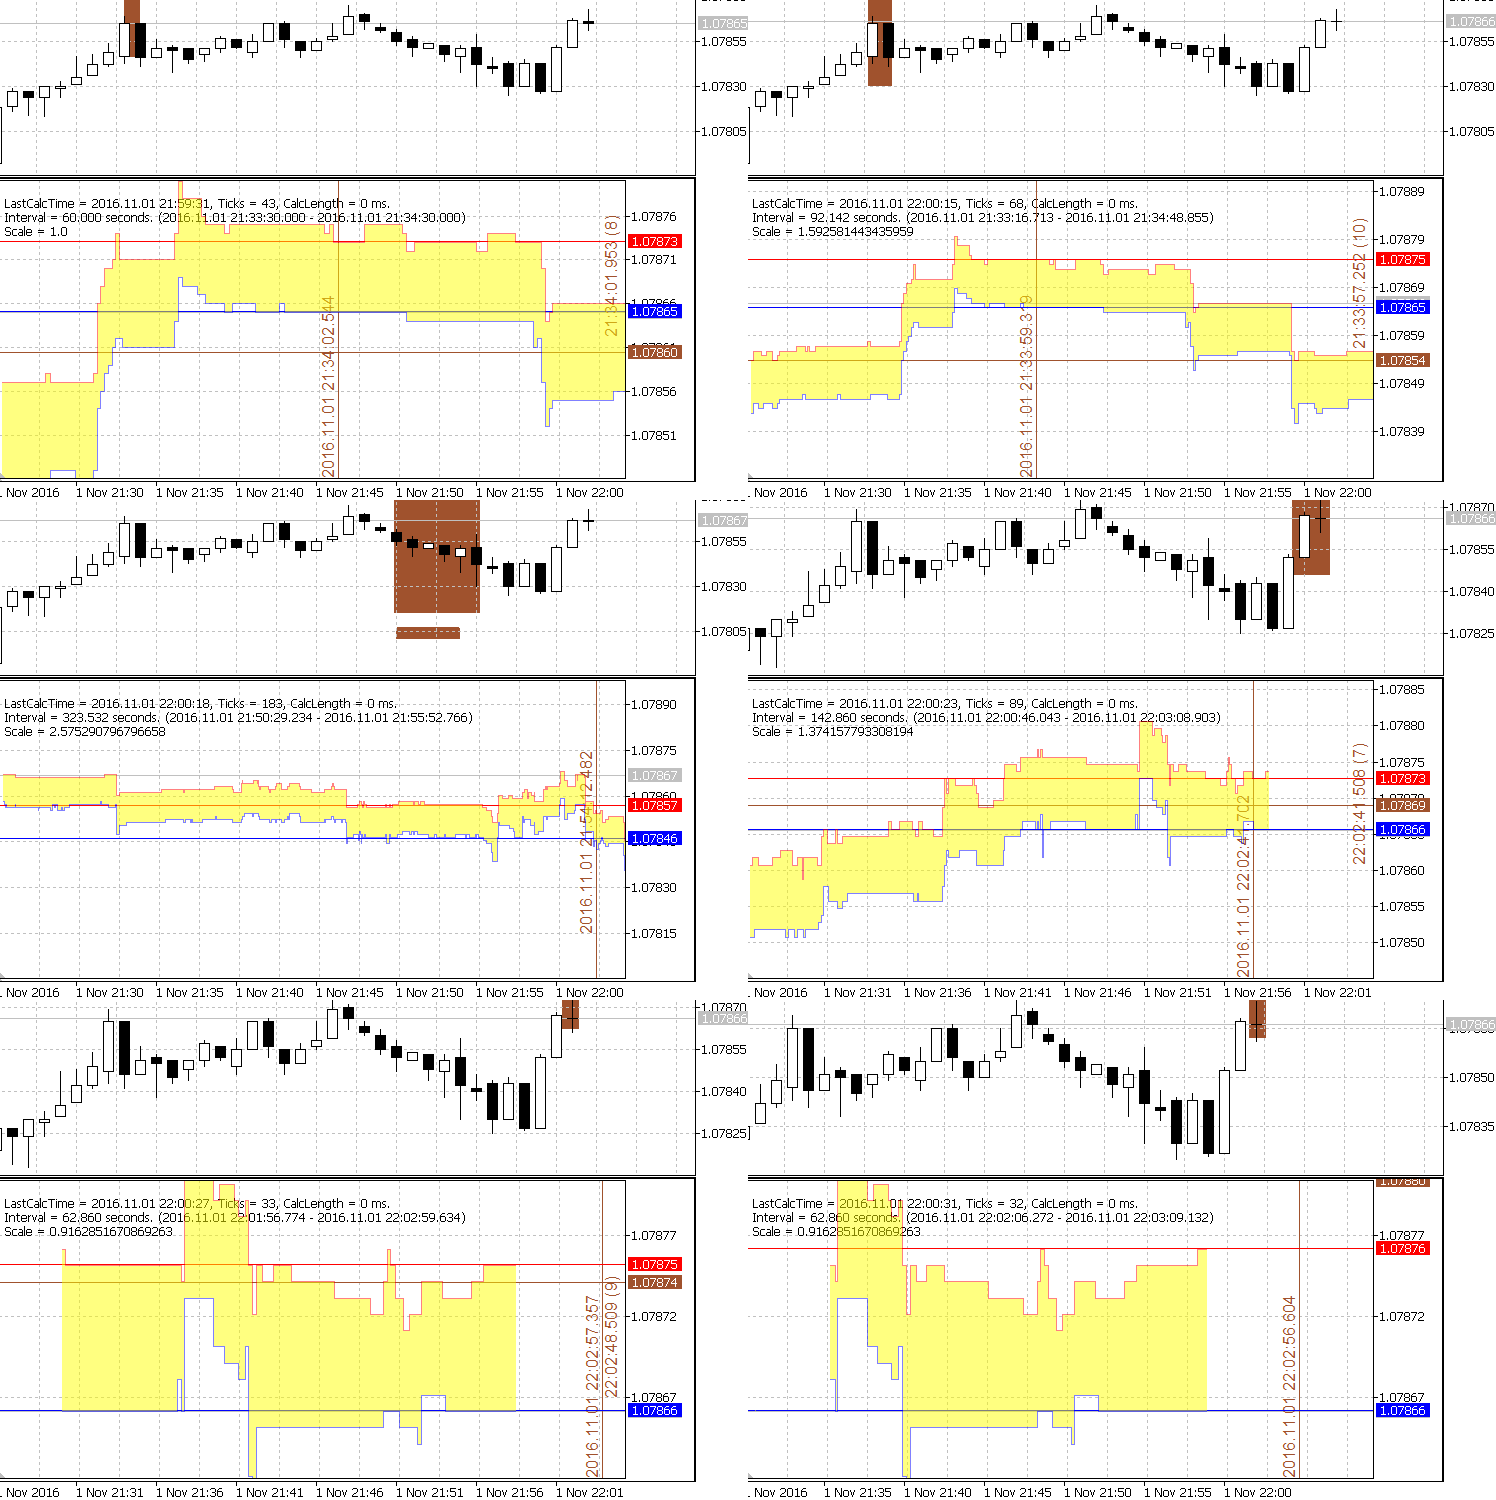
The developers have given a lot more than the tick chart on other platforms.
Even milliseconds look at
The developers have given a lot more than a tick chart on other platforms.
People want it to be like a normal chart.
To be able to attach indicators or an Expert Advisor.
Personally, I too have had the same desire as the topic starter and am also in favour.
People want it to be like a normal one.
So that indicators can be suspended or an EA can be suspended.
Personally, I too have had the same desire as the top starter and am also "FOR".
An EA can still be suspended. And indicators and timeframes are such nonsense that can only be justified by the low computing power of the platform.
An EA can still be hung. And indicators and timeframes are such nonsense that can only be justified by the low computing power of the platform.
You are not showing an indicator in the pictures?
You are not moving the mouse on the timeframe?
You are not showing an indicator in the pictures?
In the terminology of this resource it is not an indicator at all.
And you are not moving the mouse on the timeframe?
No, not on timeframe.
The program just shows a dynamic picture.
Even milliseconds look at
The developers have given a lot more than the tick chart on other platforms.
Beautiful, but not the same.
A normal tick frame is presented in the same way as a time frame in bars (candlesticks). Only the constant is not the time per bar but the number of ticks per bar (1/3/5/10/50/100 ...).
And while there is a direct connection between the number of ticks and (tick) volume, the tick frame contains information not only about the price movement, but also about the change of trading volume.
The charts differ from timeframes and someone sees interesting market signals on ticks, which he or she cannot find on TIMEframes.
Beautiful, but not the same.
A normal tick frame is represented in the same way as a time frame in bars (candlesticks). But the constant is not the time per bar but the number of ticks per bar (1/3/5/10/50/100 ...).
And while there is a direct connection between the number of ticks and (tick) volume, the tick frame contains information not only about the price movement, but also about the change of trading volume.
Charts differ from timeframes and someone sees interesting market signals on ticks, which he or she cannot find on TIMEframes.
Generally speaking, this switch between timeframes is not necessary at all.
The price scaling slider for ticks is normal
History stored solely in ticks and no more.
But this is already MT6 and most likely revolutionary
;)
A normal tick frame is represented in the same way as a time frame in bars (candlesticks). But the constant is not time per bar, but number of ticks per bar (1/3/5/10/50/100 ...).
The stock exchange will laugh at you. Everyone can create quote ticks there.
The stock exchange will laugh at you. Everyone there can create quote ticks.
That is, there are no plug-ins and all the ticks are real,
If no one trades, the price stays in one place,
right?
- Free trading apps
- Over 8,000 signals for copying
- Economic news for exploring financial markets
You agree to website policy and terms of use

The tick chart is of interest to many users. I would like to make some suggestions for its further development:
- Make the tick chart a complete trading window, but, unlike other windows, not to load history from the server, but to use only those quotations data that are saved by users (the traffic will not be increased)
- Create candlesticks by the number of ticks, not by time
I will make further suggestions, if the idea resonates with the developers.