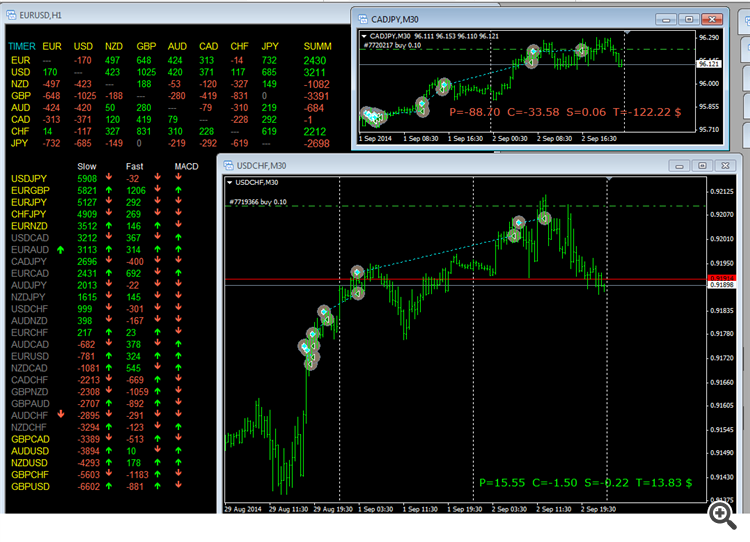
So, how are the results of trading on it?
I have been developing systems based on this principle for a couple of years now.
The main thing I want to say - this kind of analysis, as well as other indicators, shows what was, but not what will be. And if the index of one currency turned out to be overbought, and the other - to be oversold, it doesn't say that a reversal or continuation of the trend will happen right now. No way ))))
Here is a screenshot of one of the Expert Advisor for 28 currency pairs - table for calculation of indices, calculation of the most diverse pairs and ranking them. Calculation of Rate of change, trying to put other indicators on the indices themselves, opening orders, tracking, closing, etc.
We can see on the trade windows that if you choose the highest values of the "spread" indices, the market entry is at its maximums and we just hope that the trend will continue. If you work on the rebound, the opposite is true.
And so on. I.e. at the highs nothing guarantees the continuation.
I also tried to catch the Beginning of a divergence. I.e. to enter not by rating edges, but by the SPEED of the pair's movement from the middle point of the rating to the edge, or to increase the SPEED of this Speed - this is more interesting)).
In short, there is a lot of variants and reflections.
I will show you my indicator which I use to determine from which currency there is a capital flow to which currency. Each line on it is a conditional index of a particular currency (EUR, USD, GBP, JPY, CHF, CAD AUD, NZD), calculated from several currency pairs.
What notional index? How is it calculated? To work with any indicator, it is always desirable to know exactly the principle of its creation.
At first glance - just take all currencies under the dollar denominator, glue them together in the beginning, on the vertical axis - the volatility in percents. So ?
What is the notional index? How is it calculated? To work with any indicator, it is always desirable to know exactly the principle of its construction.
At first glance - just took all the currencies under the dollar denominator, glued them together in the beginning, on the vertical axis - the volatility in percents. So ?
There are 6 currency pairs used for the calculation, the average price between bid and ask is used. All other currency pairs are calculated from them. Moreover, inverse pairs EURUSD - USDEUR are also used.
At the initial calculation moment the indices of all currencies are taken equal to 1, and then it is calculated according to the following formula
indexval1 = oldindexval1 + (val1val2/oldval1val2 + val1val3/oldval1val3 + ... + val1valn/oldval1valn) / (n - 1);
n - number of currency pairs participating in the calculation;
indexval1 - current calculated value of the index;
oldindexval1 - old calculated index value;
val1valn - current value of currency pair quotation, where val1 - base currency pair, valn - quoted currency pair;
oldval1valn - old value of the currency pair quotation;
That is, at the initial moment all indexes are equal to one, and then the arithmetic mean of the sum of deviations in each currency pair is added to them.
And yes the vertical axis is in percentages.
I have been developing systems based on this principle for a couple of years now.
all indicators are cheating you have to learn to read the chart all indukes EAs are designed to make you lose your deposits.
I see. In principle, how to build a synthetic is up to the author, the main thing is to be comfortable with it.
Here is a question - if, say, you have identified a capital flow between currencies - why should there be a reverse flow, or why should this flow continue?
What is the fundamental difference between this approach and the linear standard approach - if there has been a price movement then it is more likely to continue, or not continue?
- Free trading apps
- Over 8,000 signals for copying
- Economic news for exploring financial markets
You agree to website policy and terms of use

I will show you my indicator which I use to determine from which currency there is a capital flow to which currency. Each line on it is a conditional index of a particular currency (EUR, USD, GBP, JPY, CHF, CAD AUD, NZD), calculated from several currency pairs.
EUR - brown (dark red)
USD - purple
GBP - red
JPY - dark green
CHF - dark blue
CAD - turquoise
AUD - light blue
NZD - light green (lettuce)