Machine learning in trading: theory, models, practice and algo-trading - page 436
You are missing trading opportunities:
- Free trading apps
- Over 8,000 signals for copying
- Economic news for exploring financial markets
Registration
Log in
You agree to website policy and terms of use
If you do not have an account, please register
It worked, thank you! That's interesting...
Does it look for 1 most similar option or does it average over several? Apparently it finds the 1 best one. I think I should go for 10 or even 100 variants and look for the average prediction (the exact number should be determined by the optimizer).
Yes, here it shows 1 best, I did not bother with many variants, you can try to redo, if you understand my writing )
My neuron can never learn to trade in profit using just prices. But the pattern model did, so the choice is obvious :)
It is one thing to find a "pattern", but it is quite another thing to give it a statistical advantage. IMHO I doubt it very much for some reason. In fact the search for patterns by convolution (product, difference) along the entire length of the historical series with averaging is like doing a regression in NS with ONE NEURON, that is the simplest linear model with extremely stupid signs, a slice of price as it is.
It is one thing to find a "pattern", but it is quite another thing for it to give a statistical advantage. IMHO I doubt it very much for some reason. In fact, the search for patterns by convolution (product, difference) over the entire length of the historical series with averaging, it's like doing regression in NS with ONE NEURON, that is the simplest linear model, with extremely stupid signs, a piece of price as it is.
If it is a single neuron, then with a number of inputs equal to the length of the pattern, (pattern of 30 bars = 30 NSb inputs of 500 bars = 500 NS inputs).
In my opinion, a set of neurons in internal layers of NS is an analogy of memory, 10 - 50 - 100 additional neurons are 10 - 50 - 100 memorized variants of input signals correspondingly. And comparing the pattern with 375000 variants from the history (M1 for a year), we have an absolutely accurate and complete memory, not 10 -50 - 100 most frequent variants. Then from this memory the pattern finder identifies N most similar results and gets the average prediction, while the neural network increases weights of connections between neurons with every similar pattern.
It is not clear why to use convolution, I assume that you propose to convolve the sought pattern with each variant from the history, as a result we get the 3rd temporal sequence - and how it helps to determine the similarity of the pattern and the tested variant?If it is one neuron, then with number of inputs equal to the template length, (template of 30 bars = 30 NS inputs of 500 bars = 500 NS inputs).
It's still not clear why to use convolution, I assume that you suggest to convolve sought pattern with each variant from history, as the result we get the 3rd temporal sequence - and how it helps to determine the similarity of the pattern and tested variant?
Yes, here it shows 1 best, did not bother with many options, you can try to redo, if you understand my writing )
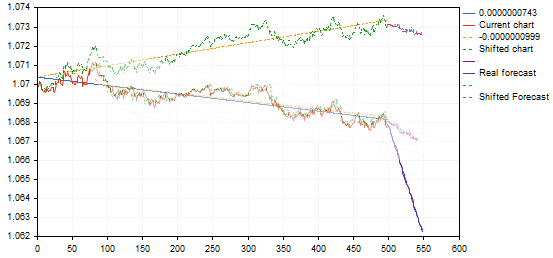
while looking at the picture, something is not quite right...
Here's a random example
Your blue forecast line goes down very steeply, with a weak movement of a similar variant...
Here is just in photoshop turned this variant and it turned out not so steep and in idea more logically.
while I'm looking at the picture, something's not quite right...
Here's a random example
Your blue forecast line goes down very steeply, with a weak movement of a similar variant...
Here's just in photoshop turned this variant and it turned out not so cool and more logical by idea.
Have you noticed :) in certain situations, for some reason it does not count the angle correctly, it started after I rewrote from a single timeframe version to a multi-timeframe one, and I have not caught where the flaw
By the way, it's possible that I didn't count it correctly at all... I didn't think to check it with Photoshop. The angle between the previous graphs and the forecasts should be the same
Exactly.
You collapse the pattern and the series where the extremes were most similar, it's simple. For example, you have a row {0,0,0,1,2,3,1,1,1} and you want to find a pattern {1,2,3} in it, the convolution gives {0,0,0,3,8,14,11,8, 6} (counted by eye) 14 at most where the "head" of our pattern is. Of course it is desirable to normalize vectors before convolution, otherwise there will be extrema in places where there are just large numbers.
Why complicate things like this? Why should we look for an extremum on the convolution if we can look for {0,0,0,1,2,3,1,1,1} specifically in the {1,2,3} series? Apart from increasing the complexity and time of calculations, I do not see any advantages.
Why make it so complicated? Why should we look for an extremum on the convolution if we can look for {0,0,0,1,2,3,1,1,1} specifically in the series {1,2,3}? Other than complicating and increasing the calculation time, I do not see any advantages.
Hmmm... what do you mean by "search specifically"? Please give me an example of a faster algorithm than convolution.
Two operations can be used: vector difference length and scalar product, difference length, believe me, is 3-10 times slower, component difference, squaring, sum, root extraction, and convolution is to multiply and add.
You need to take each piece of a row of length 3 as a vector and compare it for "similarity" to our {1,2,3}
Hmmm... what do you mean by "search specifically"? Please give me an example of a faster algorithm than convolution.
The easiest one is to stepwise shift the window width of the example you are looking for across the sequence and find the sum of the abs. values of the deltas:
0,0,0 and 1,2,3 error = (1-0)+(2-0)+(3-0)=6
0,0,1 and 1,2,3 error = (1-0)+(2-0)+(3-1)=5
0,1,2 and 1,2,3 error = (1-0)+(2-1)+(3-2)=3
1,2,3 and 1,2,3 error = (1-1)+(2-2)+(3-3)=0
2,3,1 and 1,2,3 error = (2-1)+(3-2)+Abs(1-3) = 4
Where the minimum error is the maximum similarity.
Have noticed :) in certain situations, for some reason it does not count the angle correctly, it started after I rewrote from a single-timeframe version to multi-timeframe, and never caught where the bug
By the way, it is possible that I was counting it wrong, I hadn't thought to check it using Photoshop. I don't think I've got it right with Photoshop.
I'm not sure yet, that it's correct to consider graphs to be similar with such a big difference in the slope angles. Using the same example:
the variant found gives a pullback from the upper trend point or the end of the trend, by transferring it to the pattern chart it will give a forecast for the continuation of the declining trend, and not a reversal - in fact an inverse signal. Something is wrong here.... maybe we don't need these affine transformations....? And simple correlation (minimal error) is enough?