Machine learning in trading: theory, models, practice and algo-trading - page 169
You are missing trading opportunities:
- Free trading apps
- Over 8,000 signals for copying
- Economic news for exploring financial markets
Registration
Log in
You agree to website policy and terms of use
If you do not have an account, please register
If you take candles, nothing...
But there's also glass, T&S, OI...etc...
it's an additional predictor for the iO.
I see, thank you.
If you make several trades in a minute, you won't survive on forex... and even if by some miracle you get a 1 in 1,000,000 chance, it's not certain that you'll get paid.
Well that's the trading conditions again.
If you are not able to use it, R-ka will not help you either. It's one thing to be an NS consultant, another thing to be a user. These are very different things...
I don't think anyone is, it's called taking it to the absurd, and it was intended for the moderator to understand the absurdity of his statements, Reshetov has nothing to do with it ...
You decided to calculate the average in excel and wrote something on the mql forum, you are a parasite, because you could have done it in mt5, mql has not helped the mql community, got it?
You, Michael, are also a parasite, because you use JProjection, that's how it is... :)
It has nothing to do with R-ka, what difference does it make what to write in? it's a question of convenience, no more.... Here, Reshetov wrote his JProjected in java, ban it, it's not mql, it's not useful, this what's his - parasite !!!!
that's one word.
Reshetov makes his programs under the assumption that the results will be used in MT. He has written many advisors, put forward thousands of ideas and it all works for MT, so he has done a lot as a popularizer, a lot.
You can write all you want in godmotherly swift, but you need the community to be able to use it in MT, otherwise you are of no use to the community. A community that's been cherished and nurtured, that's been expanded by investing huge amounts of money.
If there is a working idea, it is not difficult to translate it into MCL. And the fact that he writes here and not on R forums is understandable - R is bottomless, a highly specialized community is not easy to find. And for the MT community he is an absolute asset.
Crossvalidation on additional samples in another timeframe.
Suppose I have one year of training data. I want to train 12 models - one using January data and another one using February data
This is a fitting.
Let's take simple, understandable data as an example and model it... Training. Blue dots - trend. Red points-validation.
n1;n2;target
1;0;1
1;1;2
1;0;1
1;1;2
1;0;1
1;0;1
1;1;2
1;0;1
1;0;1
1;0;1
Upper left 50% trend, 50% valid. Upper right- with mixing.
For OOS(bottom) we increase the sample by stupidly adding the previous sample. Since in reality we don't know the future,
we'll enter a point with a value of 1.5. As long as the test (OOS) corresponds to the training point, everything is normal.
At 1.5, the model stumbles... Omitting the small advantages of using validation and primitiveness
In the real world we have approximately such a picture...
This is the official point of view of the resource owner.
From here
Please stop with the accusations.
Every language has its place. R is great for interactive research. This is my second day exploring it (before that I read the book) and it really looks like a powerful debugger with visualization of guts.
Working with R has immediately revealed our weaknesses:
We have released the first algorithmic trading platform with the MQL language back in 2001. Each time we increased its possibilities, but the mathematical algorithm left much to be desired. We were developing the analysis, data access, tester, distributed calculations, and then we started to sell our products.
And then it became clear that most of the solutions were stuck in a vicious circle of theanalysis, indicators and fitting. We need to let the developers get to the next level of mathematical capability.
That is why we started extending mathematical libraries in MQL5 some time ago and also released in beta Alglib, Fuzzy and Stat. They will make it easier to transfer worked-out models from other systems to MQL5 and raise the class of created analytical solutions forthe Metatrader 5 platform.
In the next 2 months you will see the progress we will make in developing the mathematical environment.
We welcome and welcome discussion of complex mathematical packages as well as articles on them. Write and send requests for papers to Rashid Umarov (Rosh). Our objective is to encourage and educate traders in more sophisticated methods, not to fence them in our own MQL5 world.
Of course, we are and will be defending our language and platform from attacks, but we are also working to develop them. So everything will be fine.
P.S.
Emphasized by me
In real life we have about the same picture...
I don't fully understand your conclusion.
The model will only work as long as it works on data known to it? I.e. when forecasting on new data it will start stumbling anyway, regardless of the breakdown type (with/without mixing)?
The only way to save money is not to trade.
I do it not only to select the model parameters but also to select the indicators and their parameters. I download 10000 indicators with different parameters and lags from mt5, then I use genetics to search both indicators used in this list and model parameters (trees in the forest, layers in the neuron, etc.). I can say that this is my way of finding the constant dependencies.
If I take a set of standard indicators with standard parameters in MT5, then I don't have any model cross validation with them, be it neuronka or trees. To find a set of indicators on which the models will give positive results in such crossvalidation is already an achievement with a lot of work and time. A positive result is a certain criterion that there are constant dependencies between all predictors in space and time. Whichever interval is taken for training - the model will find the same dependencies and rely on them.
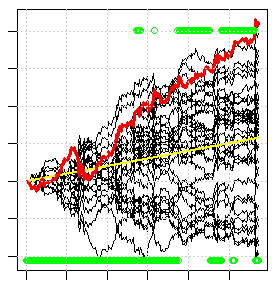
The picture below is an example of such crossvalidation. Each black line is the result (balance growth) of each separate model in the ensemble. The red line is the result of trading the majority of models in the ensemble. There about 1/3 of the models can't get to the plus side at all, given that genetics has spent more than a day to try all variants, i.e. this is one of the best results that can be found, even though the result is not even very good. If you dial any standard indicators for free, all this black fan will go down, and the red line - down beyond the screen.
Looking for solutions... In these realities.
------------------------------------------------------------------------
In the left part of the screen the drawdown is not bad, the model does not describe this area...