Why are you using iXXXX functions ??? You already have all the data in OnCalculate:
int OnCalculate(const int rates_total,
                const int prev_calculated,
                const datetime &time[],
                const double &open[],
                const double &high[],
                const double &low[],
                const double &close[],
                const long &tick_volume[],
                const long &volume[],
                const int &spread[])
I'll give an example later ...
Code: 'Candle Type.mq5'
//+------------------------------------------------------------------+
//|                                                  Candle Type.mq5 |
//|                              Copyright © 2021, Vladimir Karputov |
//+------------------------------------------------------------------+
#property copyright "Copyright © 2021, Vladimir Karputov"
#property version   "1.00"
#property indicator_chart_window
#property indicator_buffers 2
#property indicator_plots   2
//--- plot UP
#property indicator_label1  "UP"
#property indicator_type1   DRAW_ARROW
#property indicator_color1  clrDeepSkyBlue
#property indicator_style1  STYLE_SOLID
#property indicator_width1  1
//--- plot DOWN
#property indicator_label2  "DOWN"
#property indicator_type2   DRAW_ARROW
#property indicator_color2  clrTomato
#property indicator_style2  STYLE_SOLID
#property indicator_width2  1
//--- input parameters
input int      Input1=9;
//--- indicator buffers
double   UPBuffer[];
double   DOWNBuffer[];
//+------------------------------------------------------------------+
//| Custom indicator initialization function                         |
//+------------------------------------------------------------------+
int OnInit()
  {
//--- indicator buffers mapping
   SetIndexBuffer(0,UPBuffer,INDICATOR_DATA);
   SetIndexBuffer(1,DOWNBuffer,INDICATOR_DATA);
//--- setting a code from the Wingdings charset as the property of PLOT_ARROW
   PlotIndexSetInteger(0,PLOT_ARROW,159);
   PlotIndexSetInteger(1,PLOT_ARROW,159);
//--- set the vertical shift of arrows in pixels
   PlotIndexSetInteger(0,PLOT_ARROW_SHIFT,-5);
   PlotIndexSetInteger(1,PLOT_ARROW_SHIFT,-5);
//--- set as an empty value 0
   PlotIndexSetDouble(0,PLOT_EMPTY_VALUE,0.0);
   PlotIndexSetDouble(1,PLOT_EMPTY_VALUE,0.0);
//---
   return(INIT_SUCCEEDED);
  }
//+------------------------------------------------------------------+
//| Custom indicator iteration function                              |
//+------------------------------------------------------------------+
int OnCalculate(const int rates_total,
                const int prev_calculated,
                const datetime &time[],
                const double &open[],
                const double &high[],
                const double &low[],
                const double &close[],
                const long &tick_volume[],
                const long &volume[],
                const int &spread[])
  {
//---
   int limit=prev_calculated-1;
   if(prev_calculated==0)
      limit=0;
   for(int i=limit; i<rates_total; i++)
     {
      UPBuffer[i]=0.0;
      DOWNBuffer[i]=0.0;
      if(open[i]<close[i])
         UPBuffer[i]=high[i];
      else
         DOWNBuffer[i]=high[i];
     }
//--- return value of prev_calculated for next call
   return(rates_total);
  }
//+------------------------------------------------------------------+
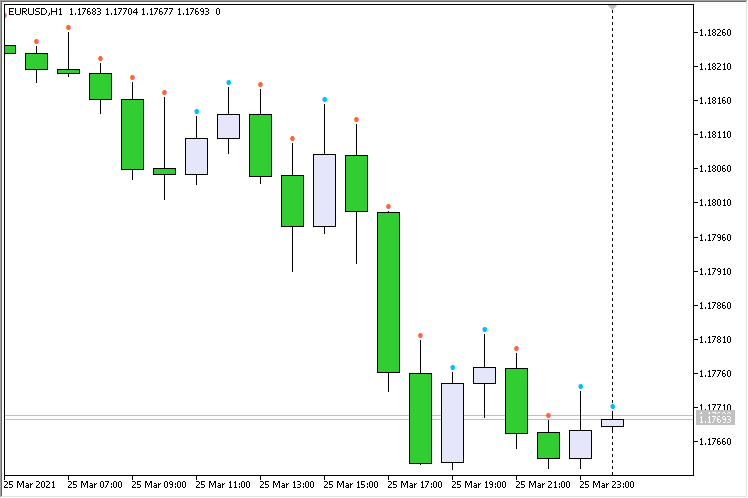
Result:

Files:
Candle_Type.mq5
6 kb
Vladimir Karputov:
Code: 'Candle Type.mq5'
Result:
Thanks for your reply Vladimir !!
I was using iXXX function because I wanted to see the color of the last candle of each timeframe (last month, last week, last day, last hour, last minute) ...
I want it to get better timing. I don't care if it's in in a "separate window" or in a "chart window" but I need to see the same thing on all charts. (something like a multimeter).
Thanks for your help, your time and your code. I'm going to study it !!
You are missing trading opportunities:
- Free trading apps
- Over 8,000 signals for copying
- Economic news for exploring financial markets
Registration
Log in
You agree to website policy and terms of use
If you do not have an account, please register
I am trying to make a very simple indicator. I just want to see if the last candle of each period is a bear or a bull.
I want to represent it with dot (red or blue). But this does not work. I don't see anything on the indicator.
IOpen and IClose does not work. I get this error (ERR_HISTORY_NOT_FOUND 440)
A little help please!!
Thank you!!
My code: