Mathematics in Trading: How to Estimate Trade Results
Sharpe Ratio
Efficiency of investments is often estimated in terms of profits dispersion. One of such indexes is Sharpe Ratio. This index shows how AHPR decreased by the risk-free rate (RFR) relates to standard deviation (SD) of the HPR sequence. The value of RFR is usually taken as equal to interest rate on deposit in the bank or interest rate on treasury obligations. In our example, AHPR=1.0217, SD(HPR)=0.17607, RFR=0.
Sharpe Ratio=(AHPR-(1+RFR))/SD where: |
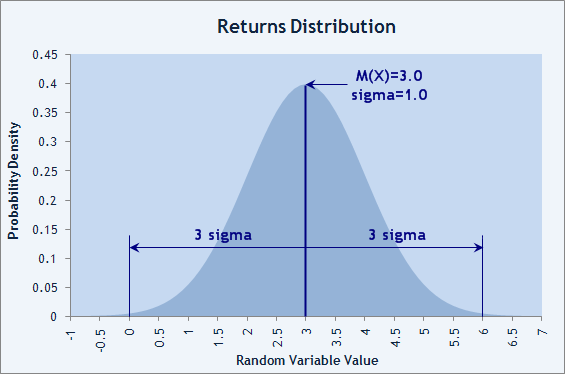
Sharpe Ratio=(1.0217-(1+0))/0.17607=0.0217/0.17607=0.1232. For normal distribution, over 99% of random values are within the range of ±3σ (sigma=SD) about the mean value M(X). It follows that the value of Sharpe Ratio exceeding 3 is very good. In Fig. 5 below, we can see that, if the trade results are distributed normally and Sharpe Ratio=3, the probability of losing is below 1% per trade according to 3-sigma rule.

Fig.5. Normal distribution of trade results with the losing probability of less than 1%.
The account of Participant named RobinHood confirms this: his EA made 26 trades at the Automated Trading Championship 2006 without any losing one among them. Sharpe Ratio=3.07!

- www.mql5.com
MetaTrader 5 Help → Algorithmic Trading, Trading Robots → Testing Report
Sharpe Ratio — this ratio characterizes efficiency and stability of a strategy. It reflects the ratio of the arithmetical mean profit for the position holding time to the standard deviation from it. The risk-free rate, which is the profit gained from the appropriate bank deposit funds is also taken into account here.

- www.metatrader5.com
Forum on trading, automated trading systems and testing trading strategies
...
Sergey Golubev, 2009.01.12 07:47
...
There are Sharpe Ratio, Modified Sharpe Ratio and Annual Sharpe Ratio. Sharp Ratio is telling us about stability (consistently) of the profit for some signals (lowest value compare with Modified Sharpe Ratio and Annual Sharpe Ratio) - read more here: The Sharpe Ratio
----------------
Sharpe Ratio is not telling us about how profitable the system/signals. It is telling us about stability of the income.
For example,
- one signal did 0.1% for the 1st month, 0.1% for the second month and 0.1% for the 3rd month. Sharpe Ratio will be very hight. Because it is stable income every month. Same with banks for example if you will deposit money to them.
- other signals did 1% return for the 1st month, -2% return for the second month and 5% for the 3rd month. Sharpe Ratio will be low. Because this signal provider is not giving stable consistent profit for every period of time.
----------------
...
Forum on trading, automated trading systems and testing trading strategies
Sharpe ratio calculation in MT5 is very unrealistic
Sergey Golubev, 2017.05.23 12:51
Yes, and this article from Sharpe:
The Sharpe RatioWilliam F. Sharpe
Stanford University
Reprinted fromThe Journal of Portfolio Management, Fall 1994
Mathematics in trading: Sharpe and Sortino ratios - the article
Experienced investors and traders often trade multiple strategies and invest in different assets in an effort to get consistent results. This is one of the concepts of smart investment which implies the creation of an investment portfolio. Each portfolio of securities/strategies has its own risk and return parameters, which should somehow be compared.
One of the most referenced tools for such comparison is the Sharpe ratio, which was developed in 1966, by Nobel laureate William F. Sharpe. The ratio calculation uses basic performance metrics, including the average rate of return, standard deviation of return and risk-free return.

- www.mql5.com
- Free trading apps
- Over 8,000 signals for copying
- Economic news for exploring financial markets
You agree to website policy and terms of use