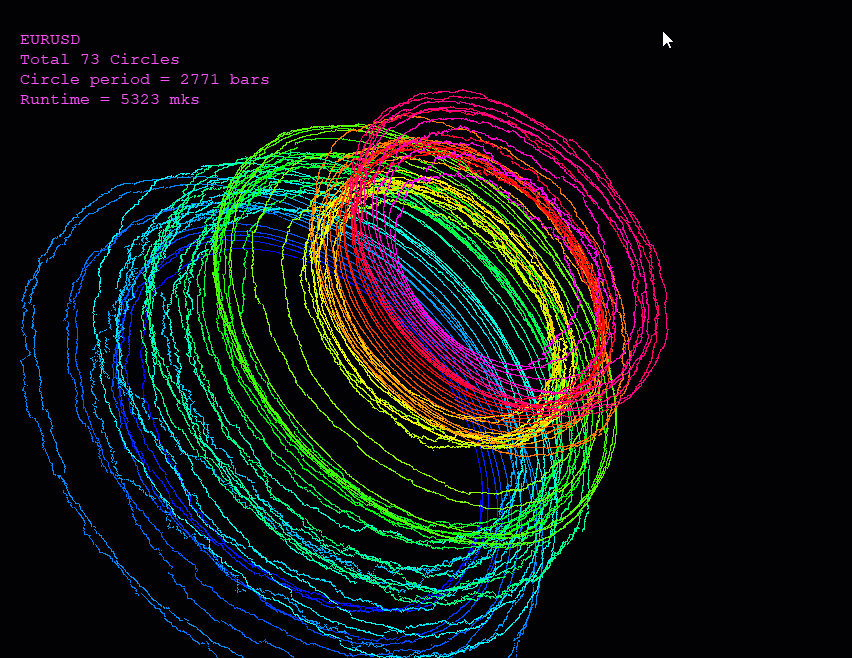
Indicators: 3D Spiral Quotes
Just magic. !!!
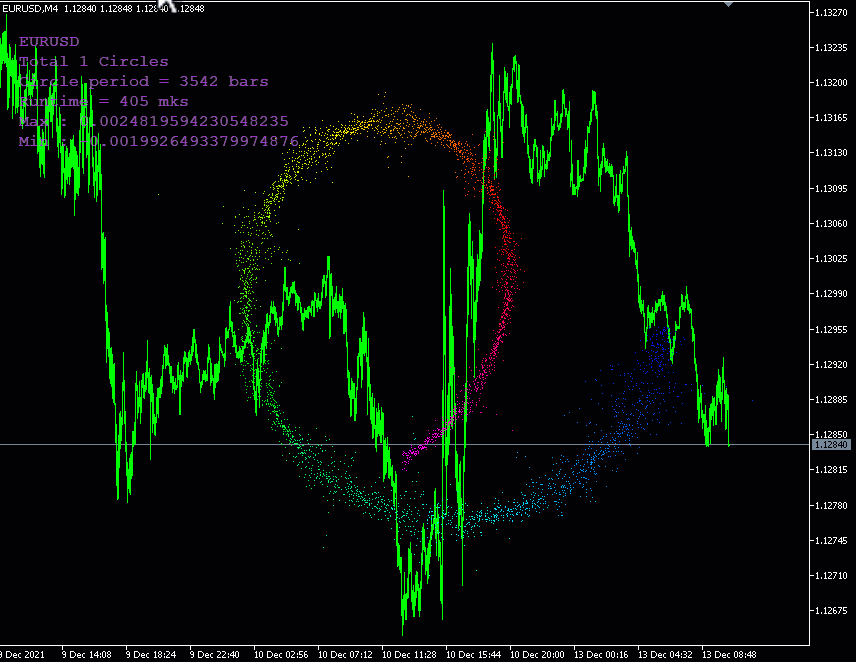
And if you add a polar grid to the axis, and the ability to change the scale, up to almost straight "parallels," we get a smooth transition to the traditional schedule.
Version 2.0
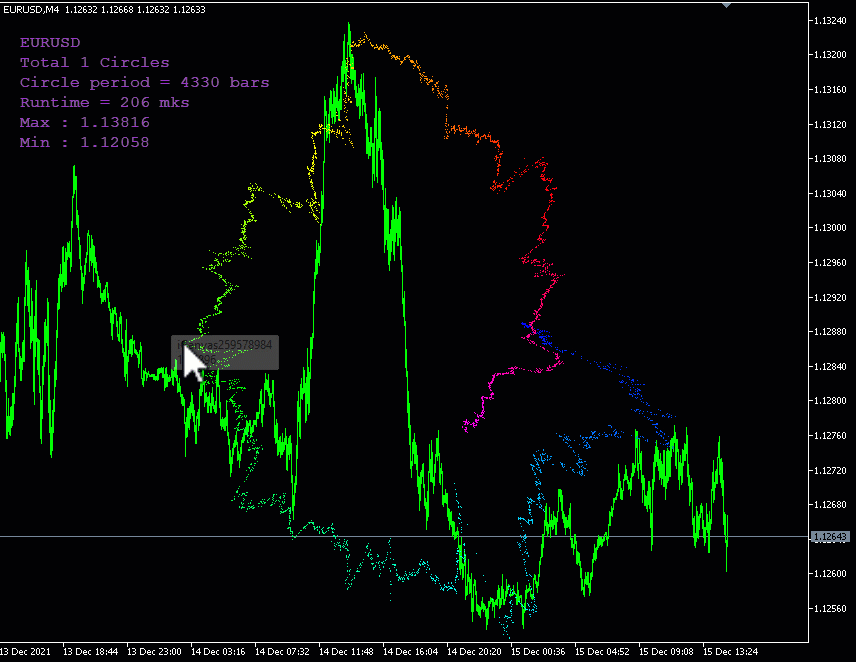
Added the ability to change the period (the number of bars in one circle). To do this, just click the left mouse button.
This is so nice
I tried a rate of change adaptation . I butchered the code though .
//+------------------------------------------------------------------+
//|                                                     3DSpiral.mq5 |
//|                        Copyright 2020, MetaQuotes Software Corp. |
//|                         https://www.mql5.com/en/users/nikolay7ko |
//+------------------------------------------------------------------+
#property copyright "Copyright 2018, Nikolay Semko"
#property link      "https://www.mql5.com/ru/users/nikolay7ko"
#property link      "SemkoNV@bk.ru"
#property version   "2.00"
#property indicator_chart_window
#property indicator_buffers 1
#property indicator_plots   0
#include "iCanvas_CB.mqh";

input int N = 200; // Maximum circles

double cl[];
int Size;
double max, min;
double _r;
int _per=0,per=0;
double K;
bool rotate = true;

//+------------------------------------------------------------------+
//|                                                                  |
//+------------------------------------------------------------------+
int OnInit() {
   ChartSetInteger(0,CHART_SHOW,false);
   SetIndexBuffer(0,cl);
   PlotIndexSetInteger(0,PLOT_DRAW_TYPE,DRAW_NONE);
   _r=_Height/2-7;
   _per=int(2*M_PI*_r);
   per = _per;
   K=100*_Height;
   return(INIT_SUCCEEDED);
}

//+------------------------------------------------------------------+
void OnDeinit(const int reason) {
   ChartSetInteger(0,CHART_SHOW,true);
}
//+------------------------------------------------------------------+
//| Custom indicator iteration function                              |
//+------------------------------------------------------------------+
int OnCalculate(const int rates_total,
                const int prev_calculated,
                const datetime &time[],
                const double &open[],
                const double &high[],
                const double &low[],
                const double &close[],
                const long &tick_volume[],
                const long &volume[],
                const int &spread[]) {
   int d=rates_total-prev_calculated;
   if (d>1 || d<0 || Size<10) {

      //Size=ArrayCopy(cl,close,0,rates_total-per*N,per*N);
        int from=rates_total-2;
        int to=1;
        if(to<1){to=1;}
        Size=0;
        for(int i=from;i>=to;i--){
        Size++;
        cl[Size-1]=(close[i]-close[i+1])/close[i+1];
        if(i==from){min=cl[Size-1];max=cl[Size-1];}else{
        if(cl[Size-1]>max){max=cl[Size-1];}
        if(cl[Size-1]<min){min=cl[Size-1];}
        }
        }

   } else {
      if (d==1) Draw();
   }
   return(rates_total);
}
//+------------------------------------------------------------------+
//| ChartEvent function                                              |
//+------------------------------------------------------------------+
void OnChartEvent(const int id,
                  const long &lparam,
                  const double &dparam,
                  const string &sparam) {
   if (id==CHARTEVENT_CLICK) rotate = !rotate;
   if (id==CHARTEVENT_MOUSE_MOVE)  {
      if (!rotate) per = int((1+5.0*_MouseX/_Width)*_per);
      Draw();
   }

}
//+------------------------------------------------------------------+
void Draw() {
   static int mx = 0,my =0;
   ulong t=GetMicrosecondCount();
   int X=_Width/2;
   int Y=_Height/2-5;
   Canvas.Erase(0xFF000000);
   Print("Range : "+(max-min));
   if (max-min<=0) return;
   int nn=0;
   double c=0;
   if (rotate) {
      mx = _MouseX;
      my = _MouseY;
   }
   int _a=(X   - mx + 5*per);
   int _b=(Y+5 - my + 5*per);

   for (int i=0; i<Size; i++) {
      double r = _r*(0.3+0.7*(cl[i]-min)/(max-min));
      int a = i;
      double cc=cos(a*2*M_PI/per);
      if (c<0 && cc>=0) nn++;
      c=cc;
      double z =r -r*2*double(i)/Size;
      double x = c*r;
      double y = sin(a*2*M_PI/per)*r;
      //double R=sqrt(x*x+y*y+z*z);
      double x1=x*cos(_a*2*M_PI/per)+z*sin(_a*2*M_PI/per);
      double z1=-x*sin(_a*2*M_PI/per)+z*cos(_a*2*M_PI/per);
      double y1=y*cos(_b*2*M_PI/per)+z1*sin(_b*2*M_PI/per);
      double z2=-y*sin(_b*2*M_PI/per)+z1*cos(_b*2*M_PI/per);
      z2=z2+_r;
      x=X+K*x1/(z2+K);
      y=Y+K*y1/(z2+K);
      _PixelSet((int)x,(int)y,Canvas.Grad(double(i)/Size));
   }
   t=GetMicrosecondCount()-t;
   _CommXY(20,30,_Symbol);
   _Comment("Total "+string(nn)+" Circles");
   _Comment("Circle period = " + string(per)+" bars");
   _Comment("Runtime = "+string (t) +" mks");
   Canvas.Update();
}
This is so nice
I tried a rate of change adaptation . I butchered the code though .
so it will be more correct and even more so you can look good in the tester (only set the Maximum circles smaller)
//+------------------------------------------------------------------+
//|                                                     3DSpiral.mq5 |
//|                        Copyright 2020, MetaQuotes Software Corp. |
//|                         https://www.mql5.com/en/users/nikolay7ko |
//+------------------------------------------------------------------+
#property copyright "Copyright 2018, Nikolay Semko"
#property link      "https://www.mql5.com/ru/users/nikolay7ko"
#property link      "SemkoNV@bk.ru"
#property version   "2.00"
#property indicator_chart_window
#property indicator_buffers 1
#property indicator_plots   0
#include <Canvas\iCanvas_CB.mqh> //https://www.mql5.com/ru/code/22164

input int N = 200; // Maximum circles

double cl[];
int Size;
double max=-DBL_MAX, min=DBL_MAX;
double _r;
int _per=0,per=0;
double K;
bool rotate = true;
int startPos = 0;

//+------------------------------------------------------------------+
//|                                                                  |
//+------------------------------------------------------------------+
int OnInit() {
   ChartSetInteger(0,CHART_SHOW,false);
   SetIndexBuffer(0,cl);
   PlotIndexSetInteger(0,PLOT_DRAW_TYPE,DRAW_NONE);
   _r=_Height/2-7;
   _per=int(2*M_PI*_r);
   per = _per;
   K=100*_Height;
   return(INIT_SUCCEEDED);
}

//+------------------------------------------------------------------+
void OnDeinit(const int reason) {
   ChartSetInteger(0,CHART_SHOW,true);
}
//+------------------------------------------------------------------+
//| Custom indicator iteration function                              |
//+------------------------------------------------------------------+
int OnCalculate(const int rates_total,
                const int prev_calculated,
                const datetime &time[],
                const double &open[],
                const double &high[],
                const double &low[],
                const double &close[],
                const long &tick_volume[],
                const long &volume[],
                const int &spread[]) {
   int d=rates_total-prev_calculated;
   Size = rates_total;
   if (prev_calculated == 0 && rates_total>per*N) startPos = rates_total-per*N;
   if (d>0) {
        int from = prev_calculated>0?prev_calculated-1:0;
        for(int i=from+1;i<Size;i++){

         cl[i]=(close[i]-close[i-1])/close[i];
         //cl[i]=close[i];
         if (i >= startPos+1) {
            if(cl[i]>max) max=cl[i];
            if(cl[i]<min) min=cl[i];
         }
        }
   } else {
      cl[Size-1]=(close[Size-1]-close[Size-2])/close[Size-2];
   }
   Draw();
   return(rates_total);
}
//+------------------------------------------------------------------+
//| ChartEvent function                                              |
//+------------------------------------------------------------------+
void OnChartEvent(const int id,
                  const long &lparam,
                  const double &dparam,
                  const string &sparam) {
   if (id==CHARTEVENT_CLICK) rotate = !rotate;
   if (id==CHARTEVENT_MOUSE_MOVE)  {
      if (!rotate) per = int((1+5.0*_MouseX/_Width)*_per);
      Draw();
   }

}
//+------------------------------------------------------------------+
void Draw() {
   static uint last = 0;
   static int mx = 0,my =0;
   uint cur = GetTickCount();
   if (cur-last<30) return;
   last = cur;
   ulong t=GetMicrosecondCount();
   int X=_Width/2;
   int Y=_Height/2-5;
   Canvas.Erase(0x00FFFFFF);
   if (max-min<=0) return;
   int nn=0;
   double c=0;
   if (rotate) {
      mx = _MouseX;
      my = _MouseY;
   }
   int _a=(X   - mx + 5*per);
   int _b=(Y+5 - my + 5*per);

   for (int i=startPos,j=0; i<Size; i++,j++) {
      double r = _r*(0.3+0.7*(cl[i]-min)/(max-min));
      double cc=cos(j*2*M_PI/per);
      if (c<0 && cc>=0) nn++;
      c=cc;
      double z =r -r*2*double(j)/(Size-startPos);
      double x = c*r;
      double y = sin(j*2*M_PI/per)*r;
      //double R=sqrt(x*x+y*y+z*z);
      double x1=x*cos(_a*2*M_PI/per)+z*sin(_a*2*M_PI/per);
      double z1=-x*sin(_a*2*M_PI/per)+z*cos(_a*2*M_PI/per);
      double y1=y*cos(_b*2*M_PI/per)+z1*sin(_b*2*M_PI/per);
      double z2=-y*sin(_b*2*M_PI/per)+z1*cos(_b*2*M_PI/per);
      z2=z2+_r;
      x=X+K*x1/(z2+K);
      y=Y+K*y1/(z2+K);
      _PixelSet((int)x,(int)y,Canvas.Grad(double(i-startPos)/(Size-startPos)));
   }
   t=GetMicrosecondCount()-t;
   _CommXY(20,30,_Symbol);
   _Comment("Total "+string(nn)+" Circles");
   _Comment("Circle period = " + string(per)+" bars");
   _Comment("Runtime = "+string (t) +" mks");
   _Comment("Max : "+string(max));
   _Comment("Min : "+string(min));
   Canvas.Update();
}
Nice thanks .
remember these ?
what if instead of controlling the period you were moving the rings to find alignments in change (visually)?
Nice thanks .
remember these ?
what if instead of controlling the period you were moving the rings to find alignments in change (visually)?
😂
it is probably easier to change the period not in bars, but in time. hour, 12 hours, day, week, month, year
I mean in theory , with a lot of quotes , if you "twist" , or , "squeeze" the display aren't you "viewing it from a different vantage point on a hyperdimensional space" ?
Im bad in math to explain this . So imagine you have 3 filled circles on 3 canvases stacked on top of each other . 1 circle per canvas .
The circles vary in opacity based on the angle . So you design the circle and as the angle progresses you increase opacity .
Each circle has a different color
If you place controls for each canvas (not circle) translation , scale , and rotation , there will be points that you are looking through and you are seeing a "different" "slice" of that domain.
😂
I mean in theory , with a lot of quotes , if you "twist" , or , "squeeze" the display aren't you "viewing it from a different vantage point on a hyperdimensional space" ?
Im bad in math to explain this . So imagine you have 3 filled circles on 3 canvases stacked on top of each other . 1 circle per canvas .
The circles vary in opacity based on the angle . So you design the circle and as the angle progresses you increase opacity .
Each circle has a different color
If you place controls for each canvas (not circle) translation , scale , and rotation , there will be points that you are looking through and you are seeing a "different" "slice" of that domain.
Yes, a lot of things can be done, if there is time and desire. 😉
- Free trading apps
- Over 8,000 signals for copying
- Economic news for exploring financial markets
You agree to website policy and terms of use
3D Spiral Quotes:
Demonstration of Canvas's capabilities using 3D spiral quotes as an example.
Author: Nikolai Semko